

Question: compare MSE from different method. Data Seasonal Adjusted Plot Qtr Time Period Actual Data Qtr Year 2001 1 1 176 1 2 3 2 3
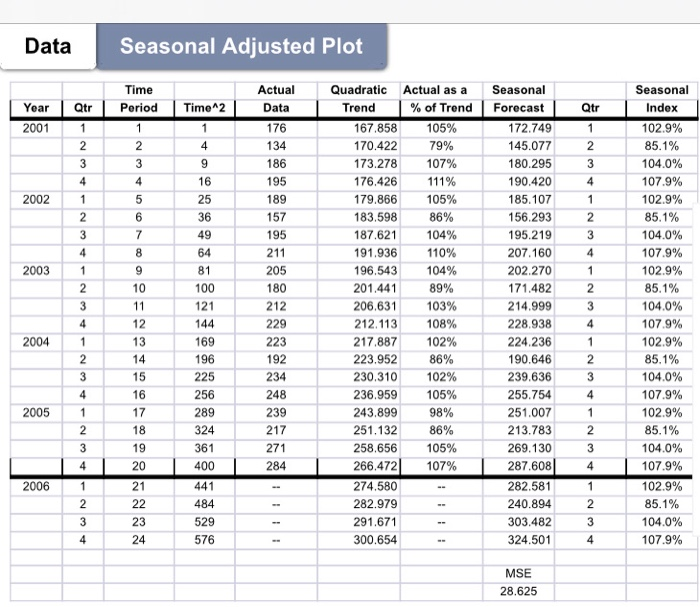
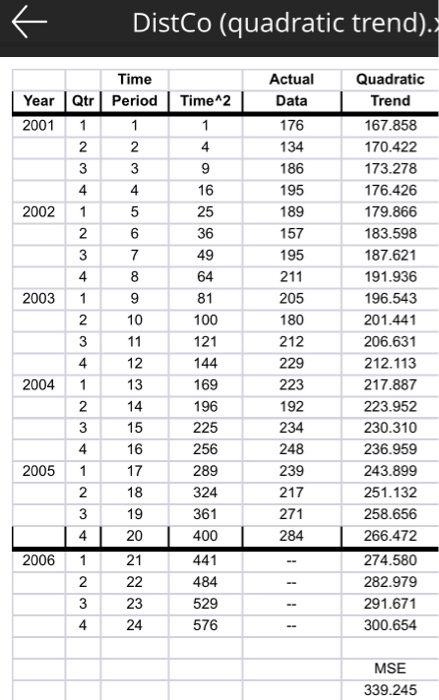
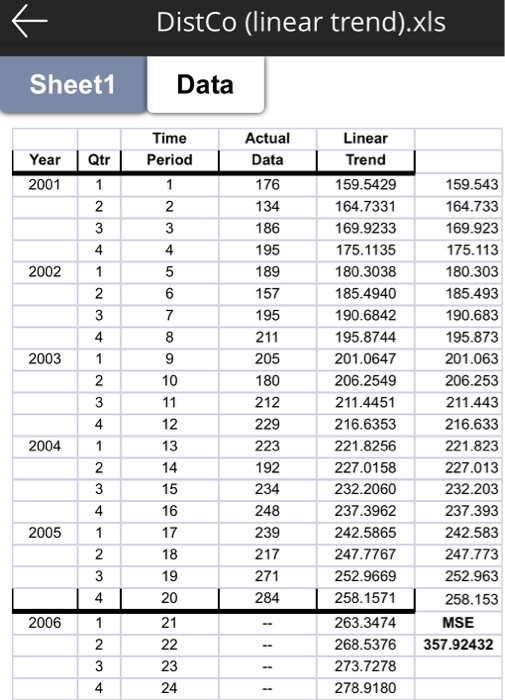
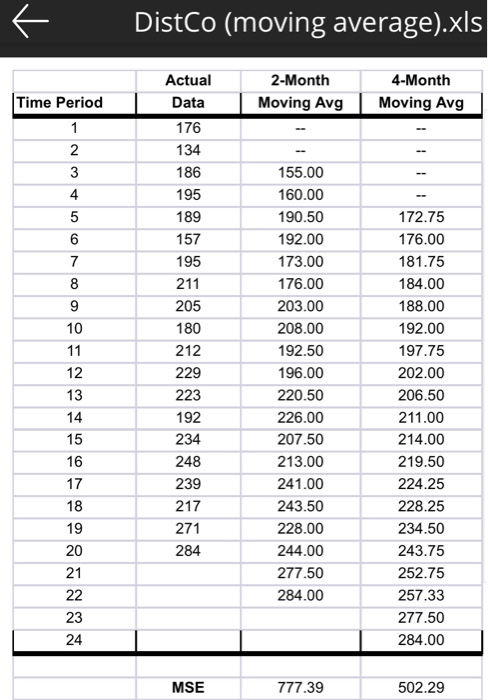
compare MSE from different method.
Step by Step Solution
There are 3 Steps involved in it
1 Expert Approved Answer
Step: 1 Unlock

Question Has Been Solved by an Expert!
Get step-by-step solutions from verified subject matter experts
Step: 2 Unlock
Step: 3 Unlock