

Question: Compare the average profit per program based on the scenarios as follows: Scenario Summary report using the average profit per program (range B10:F10 ) as

- Compare the average profit per program based on the scenarios as follows:
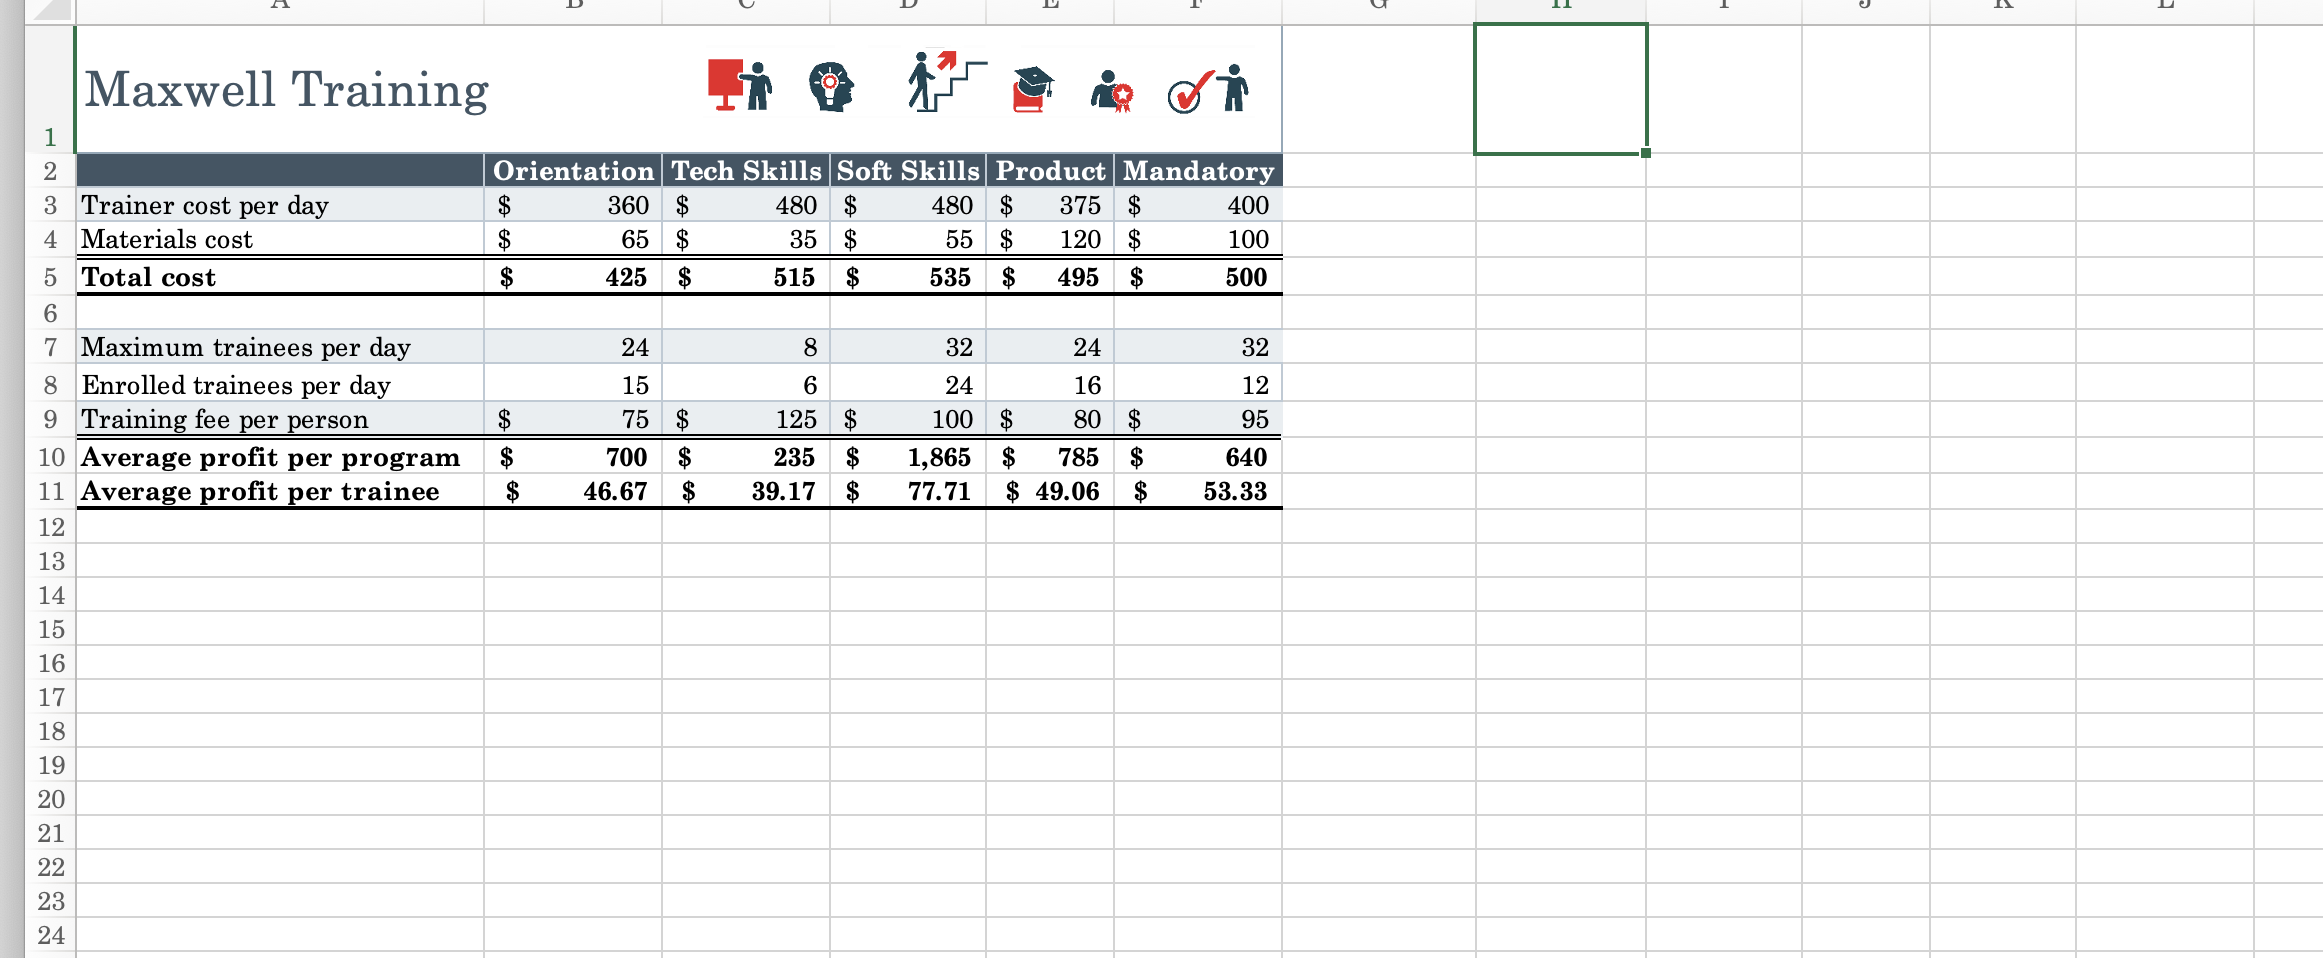
- Scenario Summary report using the average profit per program (range B10:F10) as the result cells to show how the average profit changes depending on the fee changes.
- Use New Fees Scenario Report as the name of the worksheet containing the report.
- DeShawn also wants to focus on one or two types of small-group training sessions at a time when comparing the average profit per program. Return to the New Fees worksheet and create another type of report as follows:
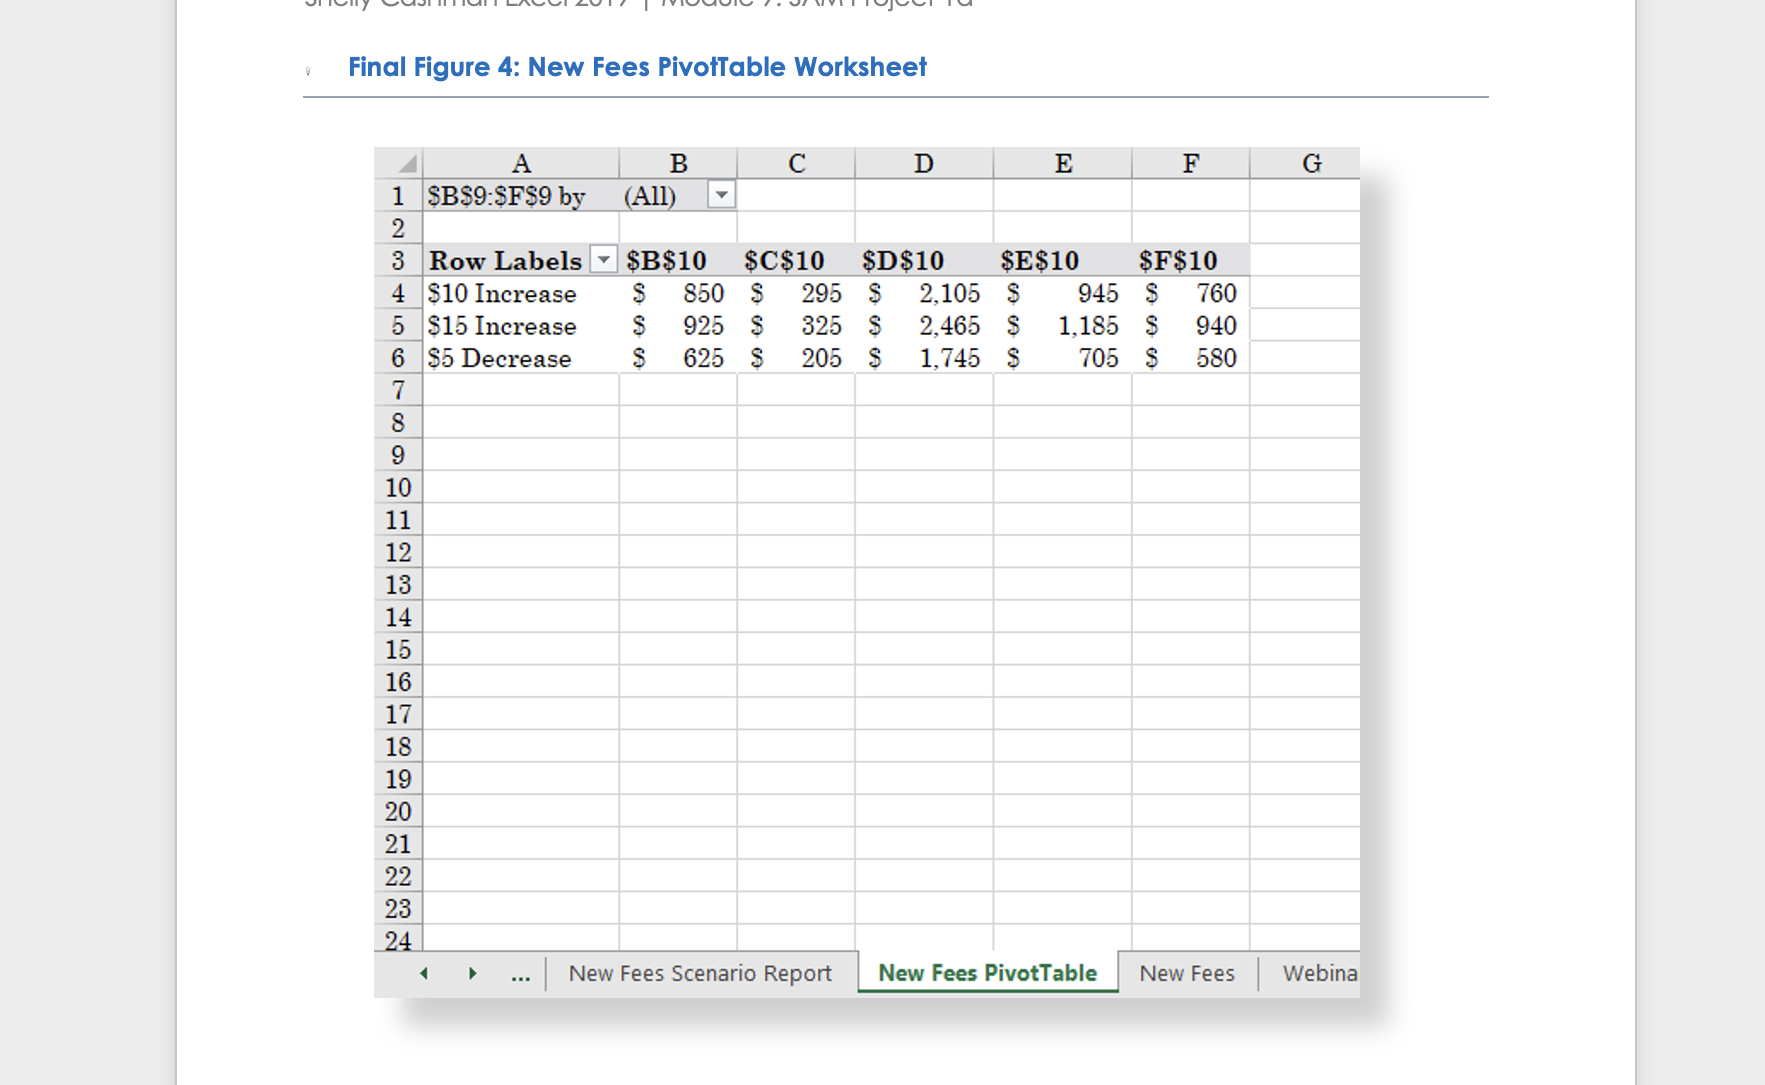
- Scenario PivotTable report using the average profit per program (range B10:F10) as the result cells to compare the average profit depending on the fee changes in a PivotTable.
- Use New Fees PivotTable as the name of the worksheet containing the PivotTable.
- Format cells B4:F6 in the New Fees PivotTable worksheet using the Accounting number format with 0 decimal places and $ as the symbol.
Final Figure 3: New Fees Scenario Report Worksheet 1 1 2 3 5 6 7 8 9 10 11 12 13 14 15 16 17 18 19 20 21 22 A B Scenario Summary Changing Cells: Result Cells: Orientation_New_Fee $ Tech_Skills_New_Fee $ Soft_Skills_New_Fee $ Product_New_Fee S Mandatory_New_Fee S Documentation $B$10 $C$10 $D$10 $E$10 $F$10 Current Values: S $ S $ D Blended Training Tutorial Fees 75 S 125 S 100 S 80 $ 95 $ 700 $ 235 S 1,865 $ 785 $ 640 S E $10 Increase 85 $ 135 $ 110 S 90 $ 105 $ Notes: Current Values column represents values of changing cells at time Scenario Summary Report was created. Changing cells for each scenario are highlighted in gray. 850 $ 295 $ 2,105 $ 945 $ 760 S New Fees Scenario Report F $15 Increase 90 $ 140 $ 125 $ 105 $ 120 $ 925 325 $ 2,465 $ 1,185 $ 940 $ $5 Decrease 70 120 95 75 90 625 205 1,745 705 580 New Fees PivotT: ... H
Step by Step Solution
There are 3 Steps involved in it
Figure 3 seems to present a table or worksheet with several columns labeled A to G and multiple rows Heres a breakdown of the information Column A This column likely represents different categories or ... View full answer

Get step-by-step solutions from verified subject matter experts