

Question: Compare the dotplot to a histogram of the data. (Select all that apply.) The raw data can be retrieved from the histogram, but not
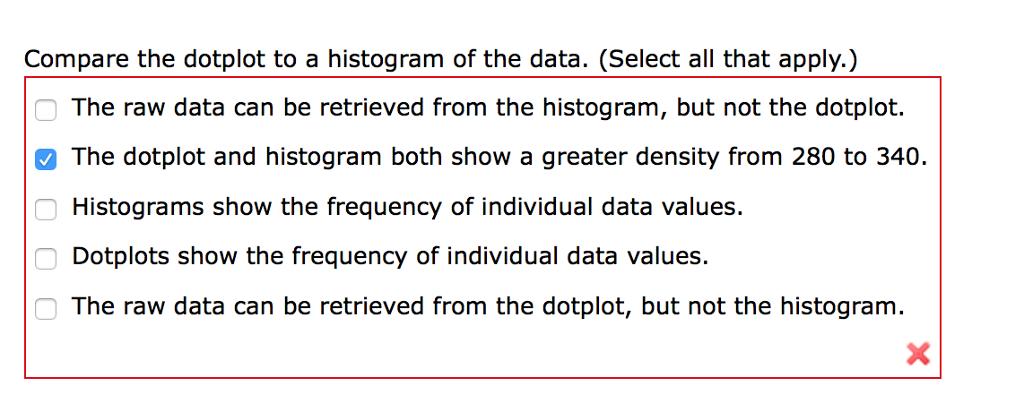
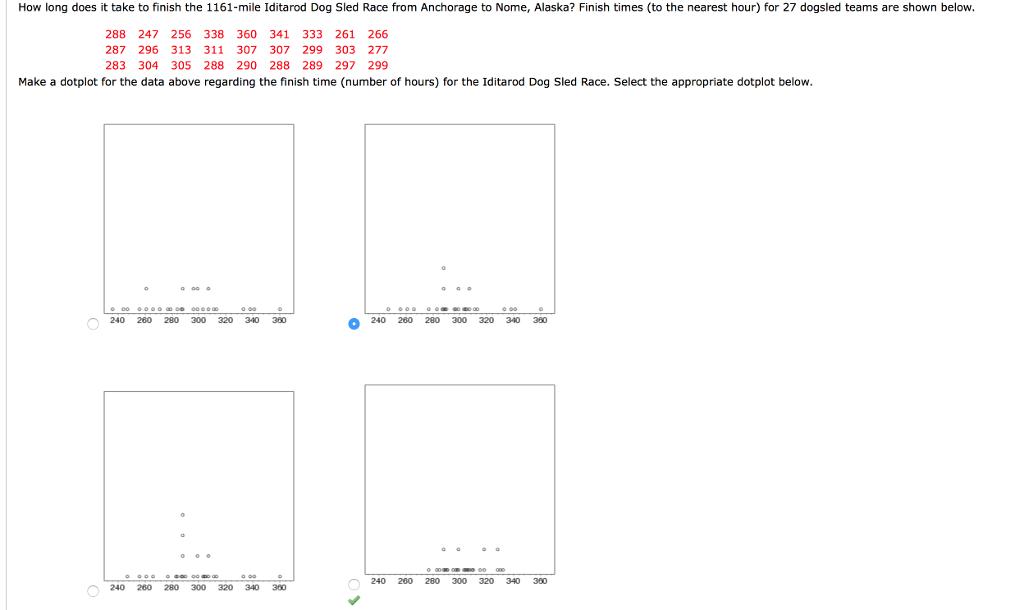
Compare the dotplot to a histogram of the data. (Select all that apply.) The raw data can be retrieved from the histogram, but not the dotplot. The dotplot and histogram both show a greater density from 280 to 340. Histograms show the frequency of individual data values. Dotplots show the frequency of individual data values. The raw data can be retrieved from the dotplot, but not the histogram. X 0003 How long does it take to finish the 1161-mile Iditarod Dog Sled Race from Anchorage to Nome, Alaska? Finish times (to the nearest hour) for 27 dogsled teams are shown below. 288 247 256 338 360 341 333 261 266 299 303 277 287 296 313 311 307 307 305 288 290 288 289 297 299 283 304 Make a dotplot for the data above regarding the finish time (number of hours) for the Iditarod Dog Sled Race. Select the appropriate dotplot below. 0 GGO 00 DO 0000000000000 0:00 D 0000000000 0:00 D 0 240 260 280 300 320 340 360 340 360 0 0 0.0 000000000000 240 260 280 300 320 O O 000 . 340 300 O 240 260 280 240 200 320 300 ... 0 MODO ODD 280 300 320 340 360
Step by Step Solution
3.53 Rating (156 Votes )
There are 3 Steps involved in it
Answers 1 is wrong 2 is true both show greater density ... View full answer

Get step-by-step solutions from verified subject matter experts