

Question: Compare the performance for 5 years (adding graph in an advantage). Provide explanation for each ratio (for example, discuss why this situation happen). Do this
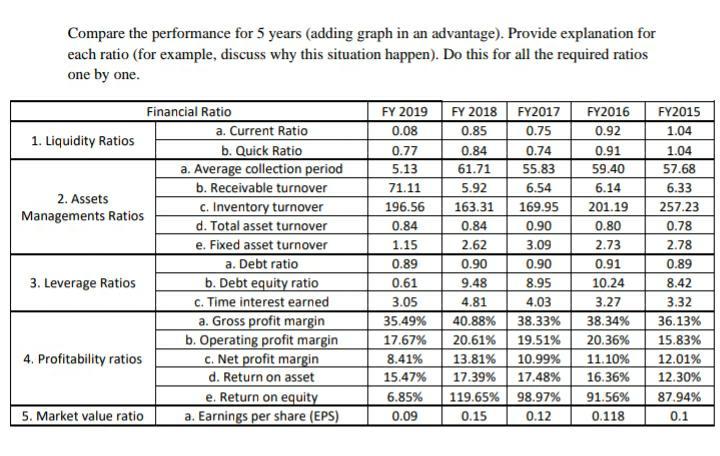
Compare the performance for 5 years (adding graph in an advantage). Provide explanation for each ratio (for example, discuss why this situation happen). Do this for all the required ratios one by one. Financial Ratio FY2016 FY2015 FY 2019 0.08 FY 2018 FY2017 0.85 0.75 a. Current Ratio 0.92 1.04 1. Liquidity Ratios 0.84 0.74 0.91 1.04 0.77 5.13 61.71 55.83 59.40 57.68 71.11 5.92 6.54 6.14 6.33 2. Assets Managements Ratios 196.56 163.31 169.95 201.19 257.23 0.84 0.84 0.90 0.80 0.78 1.15 2.62 3.09 2.73 2.78 0.89 0.90 0.90 0.91 0.89 3. Leverage Ratios b. Quick Ratio a. Average collection period b. Receivable turnover C. Inventory turnover d. Total asset turnover e. Fixed asset turnover a. Debt ratio b. Debt equity ratio c. Time interest earned a. Gross profit margin b. Operating profit margin c. Net profit margin d. Return on asset e. Return on equity a. Earnings per share (EPS) 0.61 9.48 8.95 10.24 8.42 3.05 4.81 4.03 3.27 3.32 35.49% 40.88% 38.33% 38.34% 36.13% 17.67% 20.61% 19.51% 20.36% 15.83% 4. Profitability ratios 8.41% 13.81% 10.99% 12.01% 11.10% 16.36% 15,47% 17.39% 17.48% 12.30% 6.85% 119.65% 98.97% 91.56% 87.94% 5. Market value ratio 0.09 0.15 0.12 0.118 0.1 Compare the performance for 5 years (adding graph in an advantage). Provide explanation for each ratio (for example, discuss why this situation happen). Do this for all the required ratios one by one. Financial Ratio FY2016 FY2015 FY 2019 0.08 FY 2018 FY2017 0.85 0.75 a. Current Ratio 0.92 1.04 1. Liquidity Ratios 0.84 0.74 0.91 1.04 0.77 5.13 61.71 55.83 59.40 57.68 71.11 5.92 6.54 6.14 6.33 2. Assets Managements Ratios 196.56 163.31 169.95 201.19 257.23 0.84 0.84 0.90 0.80 0.78 1.15 2.62 3.09 2.73 2.78 0.89 0.90 0.90 0.91 0.89 3. Leverage Ratios b. Quick Ratio a. Average collection period b. Receivable turnover C. Inventory turnover d. Total asset turnover e. Fixed asset turnover a. Debt ratio b. Debt equity ratio c. Time interest earned a. Gross profit margin b. Operating profit margin c. Net profit margin d. Return on asset e. Return on equity a. Earnings per share (EPS) 0.61 9.48 8.95 10.24 8.42 3.05 4.81 4.03 3.27 3.32 35.49% 40.88% 38.33% 38.34% 36.13% 17.67% 20.61% 19.51% 20.36% 15.83% 4. Profitability ratios 8.41% 13.81% 10.99% 12.01% 11.10% 16.36% 15,47% 17.39% 17.48% 12.30% 6.85% 119.65% 98.97% 91.56% 87.94% 5. Market value ratio 0.09 0.15 0.12 0.118 0.1
Step by Step Solution
There are 3 Steps involved in it

Get step-by-step solutions from verified subject matter experts