

Question: Compare the projects given below with the annual equivalent cost method. Q6 (P10): Based on the below network diagram, identify the total paths, critical path,
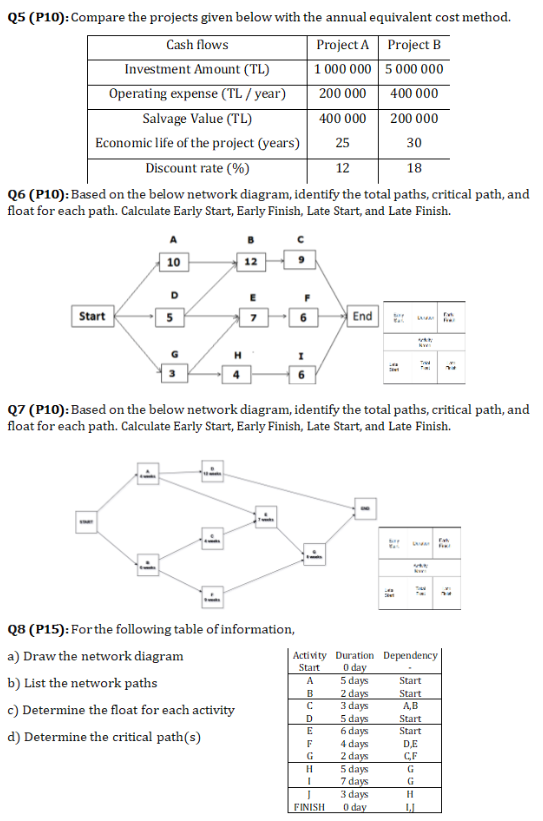
Compare the projects given below with the annual equivalent cost method.
Q6 (P10): Based on the below network diagram, identify the total paths, critical path, and float for each path. Calculate Early Start, Early Finish, Late Start, and Late Finish.
Q7 (P10): Based on the below network diagram, identify the total paths, critical path, and float for each path. Calculate Early Start, Early Finish, Late Start, and Late Finish.
Q8 (P15): For the following table of information,
a) Draw the network diagram
b) List the network paths
c) Determine the float for each activity
d) Determine the critical path(s)
Q5 (P10): Compare the projects given below with the annual equivalent cost method. Cash flows Project A Project B Investment Amount (TL) 1 000 000 5 000 000 Operating expense (TL/year) 200 000 400 000 Salvage Value (TL) 400 000 200 000 Economic life of the project (years) 25 30 Discount rate (%) 12 18 26 (P10): Based on the below network diagram, identify the total paths, critical path, and float for each path. Calculate Early Start, Early Finish, Late Start, and Late Finish. 10 12 Start 5 7 6 End H TU Q7 (P10): Based on the below network diagram, identify the total paths, critical path, and float for each path. Calculate Early Start, Early Finish, Late Start, and Late Finish. Q8 (P15): For the following table of information, a) Draw the network diagram Activity Duration Dependency b) List the network paths 2 days c) Determine the float for each activity 3 days d) Determine the critical path(s) 0 day 5 days Start A B D E F G H 5 days 6 days 4 days 2 days 5 days 7 days 3 days 0 day Start Start AB Start Start DE CF G G H - FINISH
Step by Step Solution
There are 3 Steps involved in it

Get step-by-step solutions from verified subject matter experts