

Question: Compare the two companies based on their ratios. Use the last column in the template to write in detail how each company is doing based
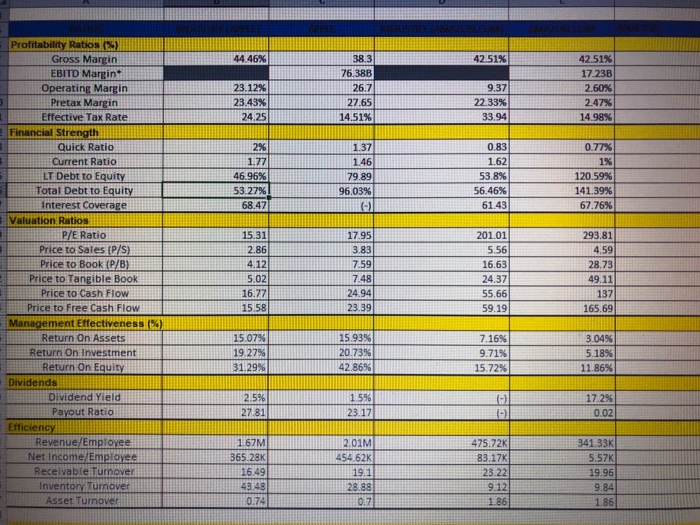
Profitability Ratios (%) 44.46% 42.51% 17.23B Gross Margin EBITD Margin Operating Margin Pretax Margin Effective Tax Rate 38.3 76.388 26.7 27.65 42.51% 23.12% 23.43% 24.25 9.37 22.33% 33,94 2.47% 14 98% Financial Strength 0.83 1.62 53896 56 46% 61.43 Quick Ratio Current Ratio 296 1.37 T Debt to Equity Total Debt to Equity Interest Coverage 46. 96% 53.27% 68.47 1% 120 59% 141.39% 67.76% 79.89 96.03% Valuation Ratio P/E Ratio Price to Sales (P/S) 15.31 17.95 3.83 7.59 748 24.94 23.39 201.01 5.56 16.63 24.37 55.66 59.19 293.81 4.12 5.02 16.77 15.58 28.73 49.11 137 165.69 Price to Tangible Book Price to Cash Flow Price to Free Cash Flow Management Effectiveness (%) Return On Assets Return On Investment Return On Equity 15.07% 19 27% 31.29% 15 93% 20 73% 42.86% 7.16% 9.71% 3.04% 518% Dividends Dividend Yield Payout Ratio 2.5% 27.81 17.2% 0.02 23.17 Revenue/Em Net Income/Em 1.67M 65.28K 16.49 2.01M 454 62K 475.72K 83.17K 341.33K 5.57K 19.96 Receivable Trnover Inventory Turnover Asset Turnover 28.88 0.74 1.86
Step by Step Solution
There are 3 Steps involved in it

Get step-by-step solutions from verified subject matter experts