

Question: Comparing confidence intervals for the population mean when... Suppose we are interested in studying a population to estimate its mean. The population is normal
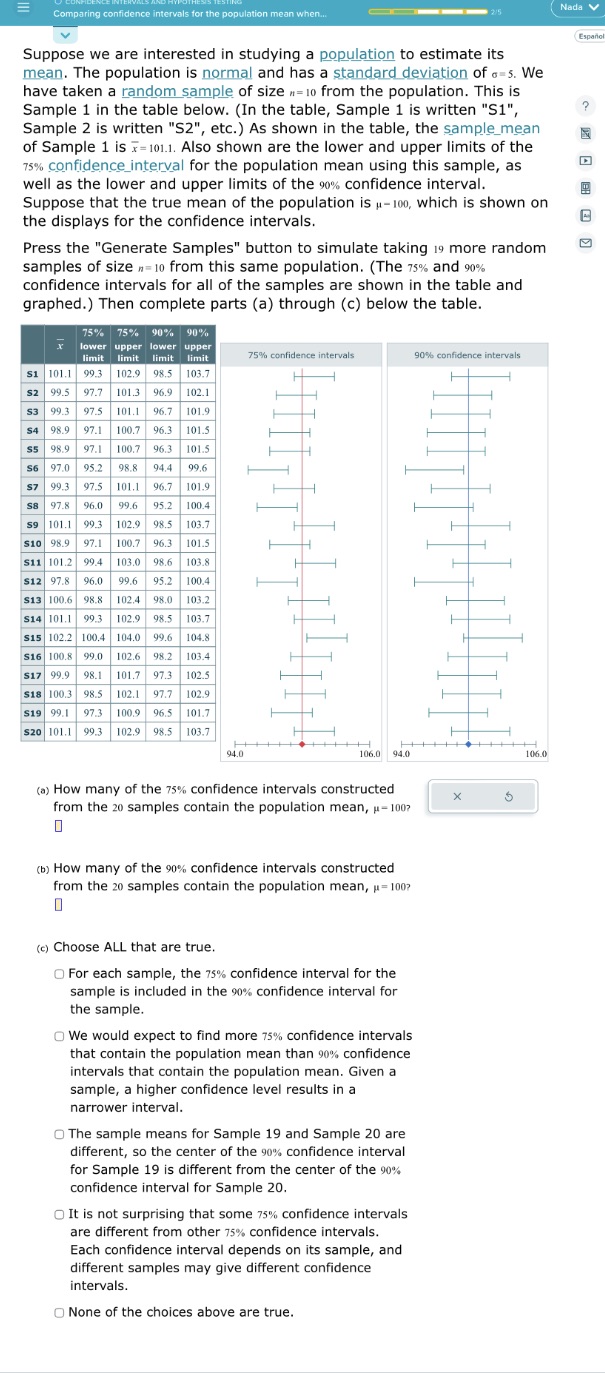
Comparing confidence intervals for the population mean when... Suppose we are interested in studying a population to estimate its mean. The population is normal and has a standard deviation of -5. We have taken a random sample of size = 10 from the population. This is Sample 1 in the table below. (In the table, Sample 1 is written "S1", Sample 2 is written "S2", etc.) As shown in the table, the sample mean of Sample 1 is x=101.1. Also shown are the lower and upper limits of the 75% confidence interval for the population mean using this sample, as well as the lower and upper limits of the 90% confidence interval. Suppose that the true mean of the population is -100, which is shown on the displays for the confidence intervals. Press the "Generate Samples" button to simulate taking 19 more random samples of size n=10 from this same population. (The 75% and 90% confidence intervals for all of the samples are shown in the table and graphed.) Then complete parts (a) through (c) below the table. 75% 75% 90% 90% lower upper lower upper limit limit limit limit 102.9 98.5 103.7 101.3 96.9 101.1 96.7 101.9 102.1 S1 101.1 99.3 S2 99.5 97.7 S3 S4 99.3 97.5 98.9 97.1 55 98.9 97.1 S6 97.0 95.2 57 99.3 97.5 S8 97.8 96.0 59 101.1 99.3 99.6 95.2 100.4 102.9 98.5 103.7 100.7 96.3 101.5 100.7 96.3 101.5 98.8 94.4 99.6 101.1 96.7 101.9 75% confidence intervals 90% confidence intervals $10 98.9 97.1 100.7 96.3 101.5 511|1012| 994 103.0 98.6 103.8 S12 97.8 96.0 $13 100.6 98.8 S14 101.1 99.3 99.6 95.2 100.4 102.4 98.0 103.2 102.9 98.5 103.7 515102.2 100.4 | 104.0 99.6 104.8 S16 100.8 99.0 102.6 98.2 103.4 S17 99.9 98.1 101.7 97.3 102.5 $18 100.3 98.5 102.1 97.7 102.9 $19 99.11 97.3 100.9 96.5 101.7 $20 101.1 99.3 102.9 98.5 103.7 94.0 106.0 94.0 106.0 (a) How many of the 75% confidence intervals constructed from the 20 samples contain the population mean, -100? I (b) How many of the 90% confidence intervals constructed from the 20 samples contain the population mean, -100? (c) Choose ALL that are true. For each sample, the 75% confidence interval for the sample is included in the 90% confidence interval for the sample. We would expect to find more 75% confidence intervals that contain the population mean than 90% confidence intervals that contain the population mean. Given a sample, a higher confidence level results in a narrower interval. The sample means for Sample 19 and Sample 20 are different, so the center of the 90% confidence interval for Sample 19 is different from the center of the 90% confidence interval for Sample 20. It is not surprising that some 75% confidence intervals are different from other 75% confidence intervals. Each confidence interval depends on its sample, and different samples may give different confidence intervals. None of the choices above are true. Nada Espaol
Step by Step Solution
There are 3 Steps involved in it

Get step-by-step solutions from verified subject matter experts