

Question: 11.32. Table P11.9 shows a six-variable RSM design from Jones and Nachtsheim (2011b). Analyze the response data from this experiment. Run (i) Xi.1 Xi.2 Xi.3
11.32. Table P11.9 shows a six-variable RSM design from Jones and Nachtsheim (2011b). Analyze the response data from this experiment.
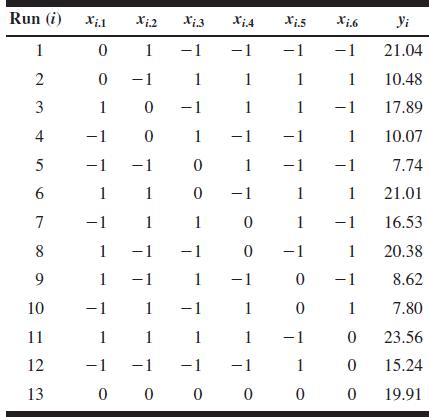
Run (i) Xi.1 Xi.2 Xi.3 Xi.A Xi.5 Xi.6 Yi 1 0 1 -1 -1 -1 -1 21.04 23 2 0 -1 1 1 1 1 10.48 10 -1 1 1 -1 17.89 4 T 0 1 1 10.07 5 -1 -1 0 1 -1 -1 7.74 6 11 0 -1 1 1 21.01 7 -1 1 1 0 1 -1 16.53 68 1 -1 -1 0 -1 1 20.38 9 1 -1 1 -1 0 -1 8.62 10 -1 1 -1 1 0 1 7.80 11 1 1 1 1 -1 0 23.56 12 -1 -1 -1 -1 1 0 15.24 13 0 0 0 0 0 0 19.91
Step by Step Solution
There are 3 Steps involved in it
1 Expert Approved Answer
Step: 1 Unlock

Question Has Been Solved by an Expert!
Get step-by-step solutions from verified subject matter experts
Step: 2 Unlock
Step: 3 Unlock