

Question: Compensation & Training Prior - Year Compensation and Productivity Data Table North America Facility Europe - Africa Facility Asia - Pacific Facility Latin America Facility
Compensation & Training
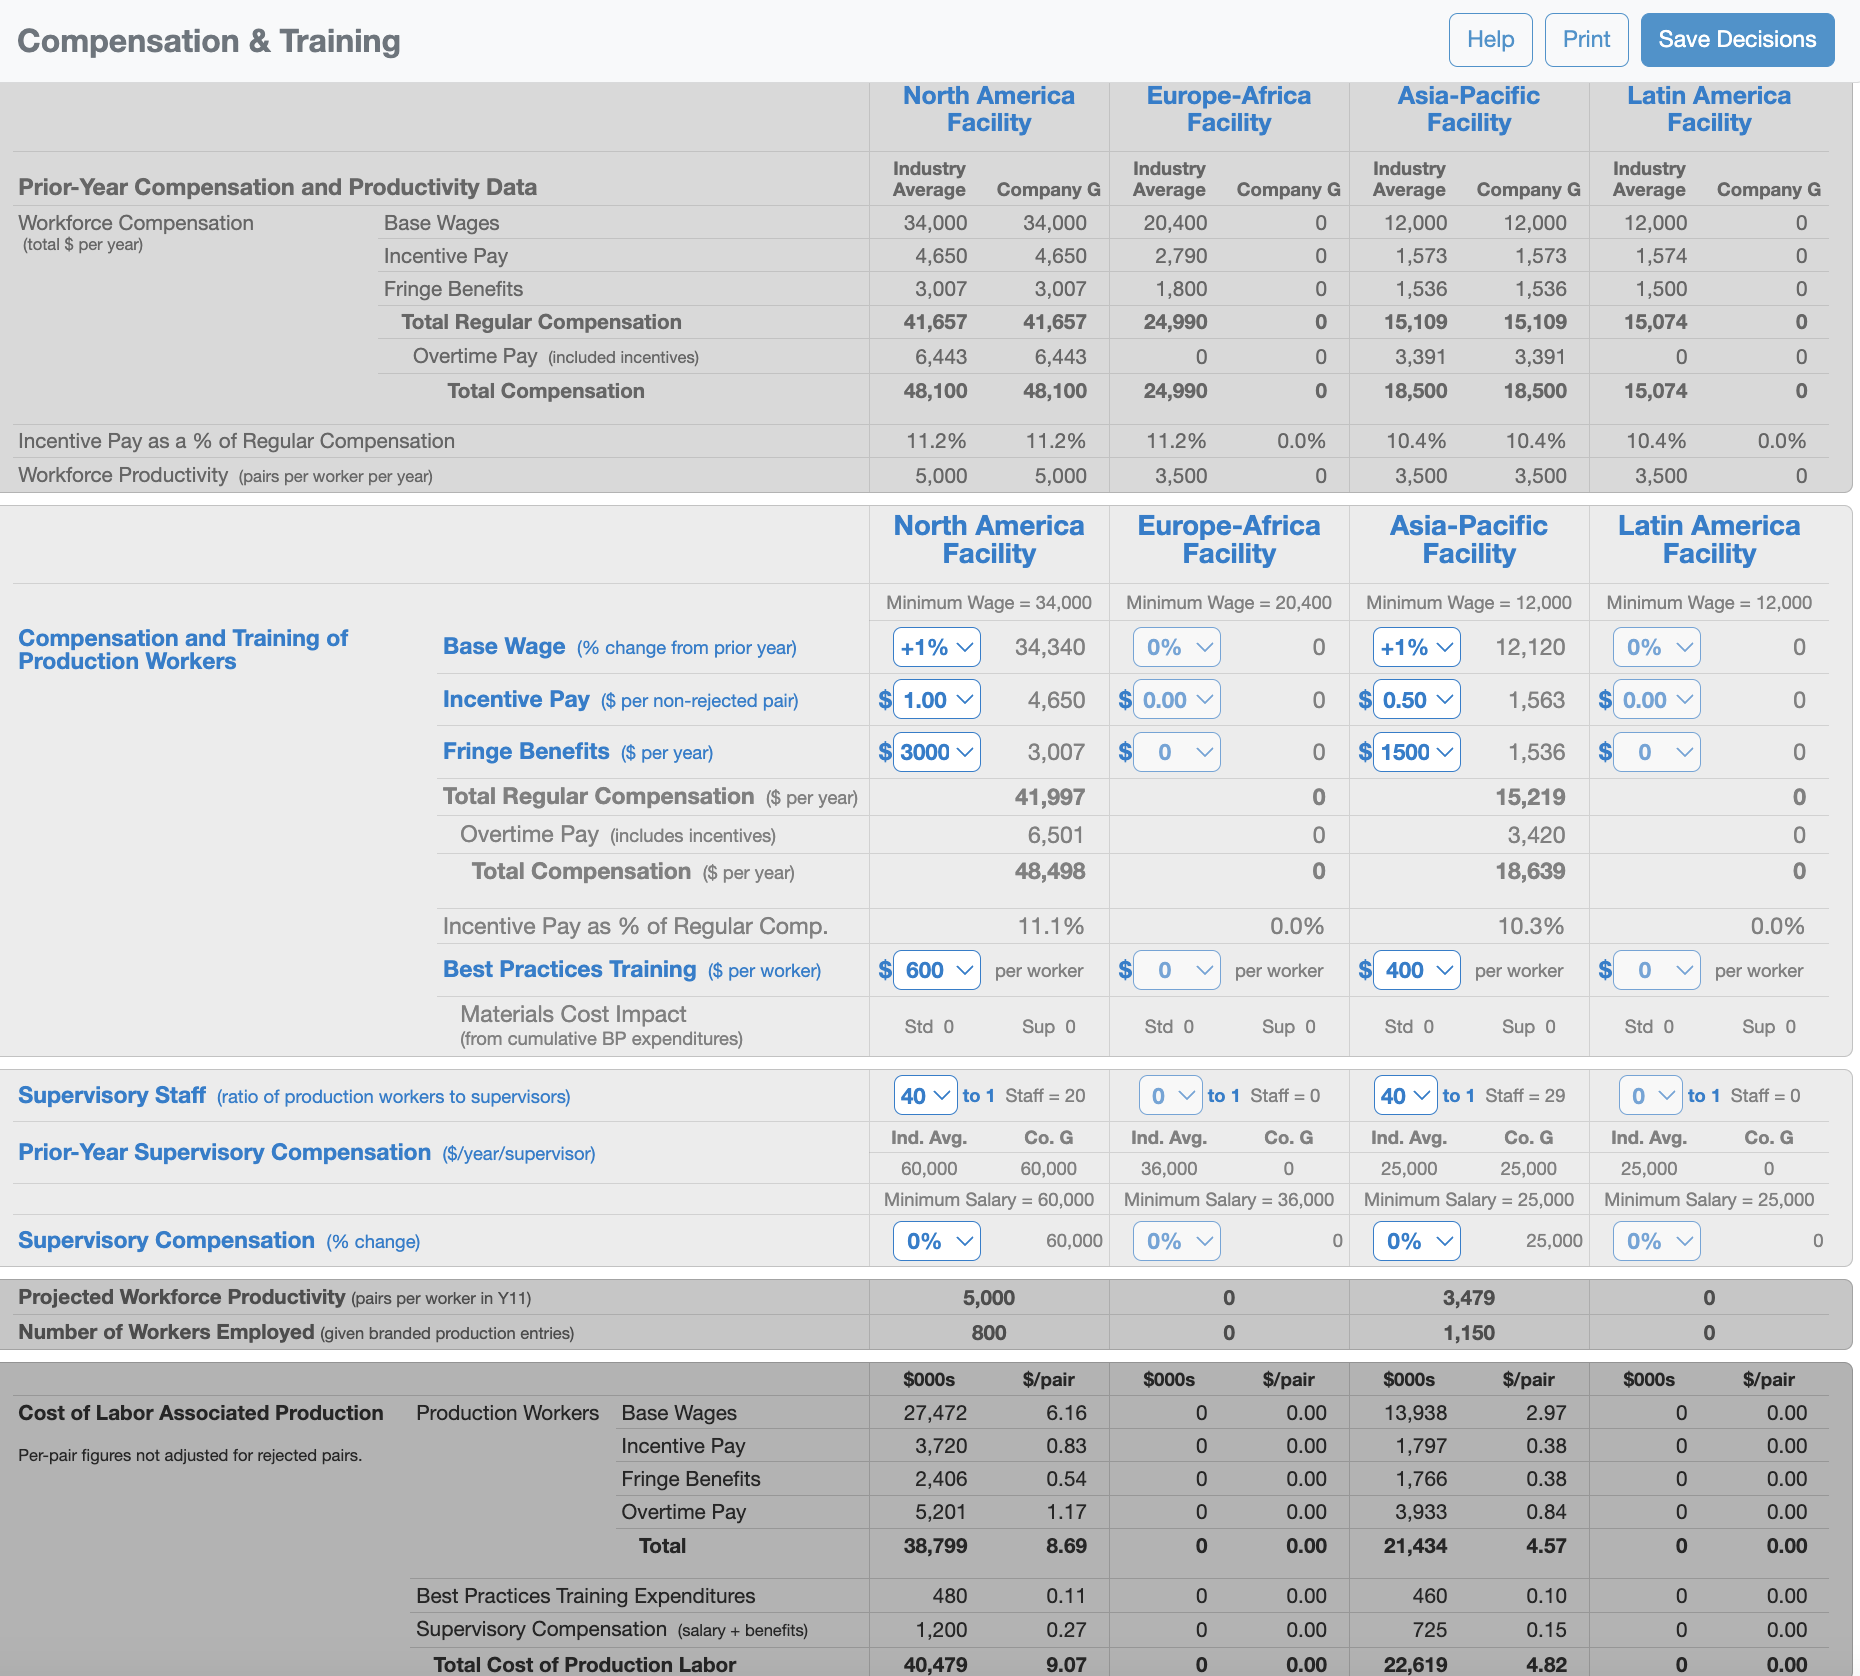
PriorYear Compensation and Productivity Data Table
North America
Facility EuropeAfrica
Facility AsiaPacific
Facility Latin America
Facility
PriorYear Compensation and Productivity Data Industry Average Company G Industry Average Company G Industry Average Company G Industry Average Company G
Workforce Compensation
total $ per year Base Wages
Incentive Pay
Fringe Benefits
Total Regular Compensation
Overtime Pay included incentives
Total Compensation
Incentive Pay as a of Regular Compensation
Workforce Productivity pairs per worker per year
Compensation and Training of Production Workers Decision Entries Table
North America
Facility EuropeAfrica
Facility AsiaPacific
Facility Latin America
Facility
Minimum Wage Minimum Wage Minimum Wage Minimum Wage
Compensation and Training of Production Workers Base Wage change from prior year
Incentive Pay $ per nonrejected pair
$
$
$
$
Fringe Benefits $ per year
$
$
$
$
Total Regular Compensation $ per year
Overtime Pay includes incentives
Total Compensation $ per year
Incentive Pay as of Regular Comp.
Best Practices Training $ per worker
$
per worker
$
per worker
$
per worker
$
per worker
Materials Cost Impact
from cumulative BP expenditures Std Sup Std Sup Std Sup Std Sup
Supervisory Staff ratio of production workers to supervisors
to
Staff
to
Staff
to
Staff
to
Staff
PriorYear Supervisory Compensation $yearsupervisor Ind. Avg. Co G Ind. Avg. Co G Ind. Avg. Co G Ind. Avg. Co G
Minimum Salary Minimum Salary Minimum Salary Minimum Salary
Supervisory Compensation change
Projected Workforce Productivity pairs per worker in Y
Number of Workers Employed given branded production entries
Cost of Labor Associated Production Table
$s $pair $s $pair $s $pair $s $pair
Cost of Labor Associated Production
Perpair figures not adjusted for rejected pairs. Production Workers Base Wages
Incentive Pay
Fringe Benefits
Overtime Pay
Total
Best Practices Training Expenditures
Supervisory Compensation salary benefits
Total Cost of Production Labor
Projected Y Performance
Projections Help File
Projected EPS, ROI, Credit Rating & Image Rating for Year
Scoring Measures Year Investor Expect.
Earnings Per Share $ $
Return On Equity
Credit Rating A B
Image Rating
Projected Net Revenues, Net Profit, and Ending Cash for Year
Other Measures Year Change from Y
Net Revenues $s
Net Profit $s
Ending Cash $s
Step by Step Solution
There are 3 Steps involved in it
1 Expert Approved Answer
Step: 1 Unlock

Question Has Been Solved by an Expert!
Get step-by-step solutions from verified subject matter experts
Step: 2 Unlock
Step: 3 Unlock