

Question: Competencies: Use marginal (cost-benefit) analysis in decision making - Develop a rationale for economic systems. A. Define Economics and explain why it is import for
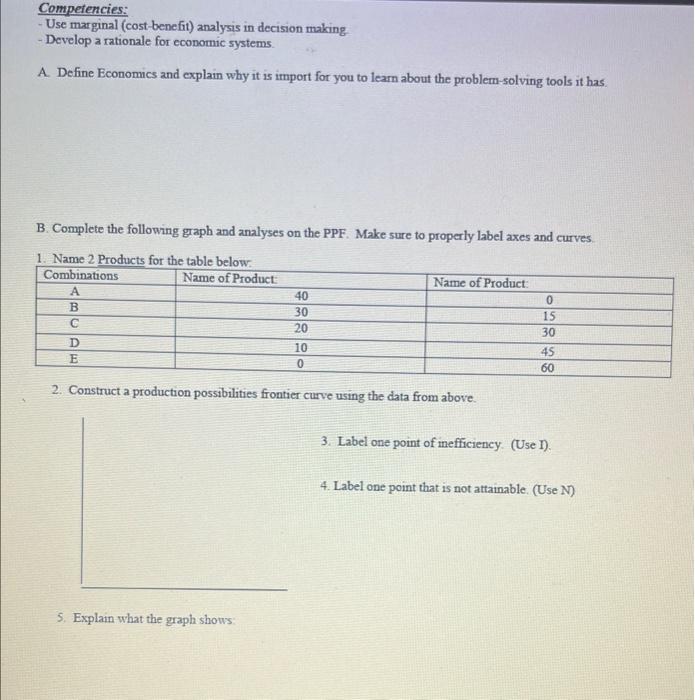
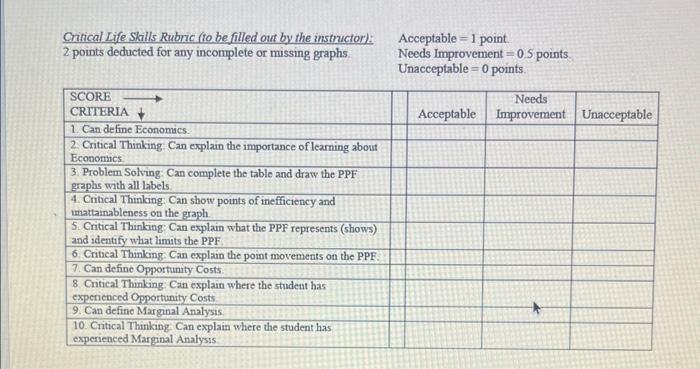
Competencies: Use marginal (cost-benefit) analysis in decision making - Develop a rationale for economic systems. A. Define Economics and explain why it is import for you to leam about the problem-solving tools it has. B. Complete the following graph and analyses on the PPF. Make sure to properly label axes and curves. 2. Construct a production possibilities frontier curve using the data from above. 3. Label one point of inefficiency. (Use I. 4. Label one point that is not attainable, (Use N) 5. Explain what the graph shows: 6. All points on the curve represent efficiency. Deseribe what is happening with opportunity costs between the points (combinations) of a to b and then b to c. a tob b to C. Define and briefly explain bow you have experienced each of the following Opportunity Costs: C. Define and briefly explain how you have experienced each of the following: Opportunity Costs: Marginal Analysis: Critical Life Skills Rubric (to be filled out by the instructor): 2 points deducted for any incomplete or missing graphs Competencies: Use marginal (cost-benefit) analysis in decision making - Develop a rationale for economic systems. A. Define Economics and explain why it is import for you to leam about the problem-solving tools it has. B. Complete the following graph and analyses on the PPF. Make sure to properly label axes and curves. 2. Construct a production possibilities frontier curve using the data from above. 3. Label one point of inefficiency. (Use I. 4. Label one point that is not attainable, (Use N) 5. Explain what the graph shows: 6. All points on the curve represent efficiency. Deseribe what is happening with opportunity costs between the points (combinations) of a to b and then b to c. a tob b to C. Define and briefly explain bow you have experienced each of the following Opportunity Costs: C. Define and briefly explain how you have experienced each of the following: Opportunity Costs: Marginal Analysis: Critical Life Skills Rubric (to be filled out by the instructor): 2 points deducted for any incomplete or missing graphs
Step by Step Solution
There are 3 Steps involved in it

Get step-by-step solutions from verified subject matter experts