

Question: Complete a Monte Carlo simulation to evaluate Anticipated periodic destructions. Enter the NORM.INV() function in the specified INPUT cells to generate 30 random projected distribution
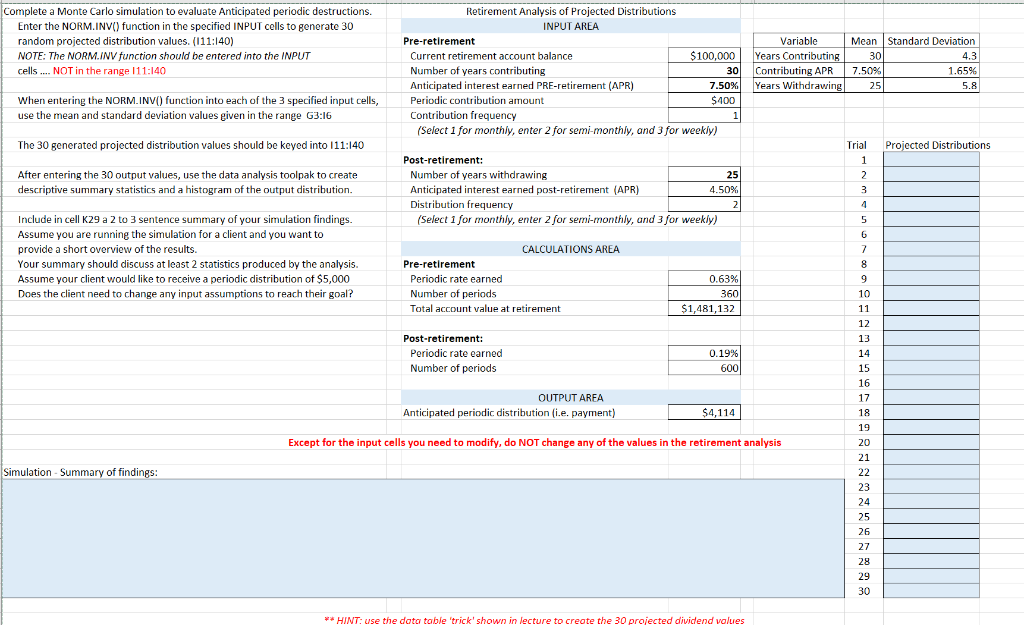
Complete a Monte Carlo simulation to evaluate Anticipated periodic destructions. Enter the NORM.INV() function in the specified INPUT cells to generate 30 random projected distribution values. (111:140) NOTE: The NORM.INV function should be entered into the INPUT cells.... NOT in the range 111:140 $100,000 Retirement Analysis of Projected Distributions INPUT AREA Pre-retirement Current retirement account balance Number of years contributing 30 Anticipated interest earned PRE-retirement (APR) 7.50% Periodic contribution amount $400 Contribution frequency 1 (Select 1 for monthly, enter 2 for semi-monthly, and 3 for weekly) Variable Years Contributing Contributing APR Years Withdrawing Mean Standard Deviation 30 4.3 7.50% 1.65% 25 5.8 When entering the NORM.INV() function into each of the 3 specified input cells, use the mean and standard deviation values given in the range G3:16 The 30 generated projected distribution values should be keyed into 111:140 Projected Distributions After entering the 30 output values, use the data analysis toolpak to create descriptive summary statistics and a histogram of the output distribution. Post-retirement: Number of years withdrawing 25 Anticipated interest earned post-retirement (APR) 4.50% Distribution frequency 2 (Select 1 for monthly, enter 2 for semi-monthly, and 3 for weekly) Trial 1 2 3 4 5 Include in cell K29 a 2 to 3 sentence summary of your simulation findings Assume you are running the simulation for a client and you want to provide a short overview of the results. Your summary should discuss at least 2 statistics produced by the analysis. Assume your client would like to receive a periodic distribution of $5,000 Does the client need to change any input assumptions to reach their goal? CALCULATIONS AREA Pre-retirement Periodic rate earned Number of periods Total account value at retirement 0.63% 360 $1,481,132 Post-retirement: Periodic rate earned Number of periods 6 7 8 9 10 11 12 13 14 15 16 17 18 19 0.19% 6001 OUTPUT AREA Anticipated periodic distribution (ie, payment) $4,114 Except for the input cells you need to modify, do NOT change any of the values in the retirement analysis Simulation Summary of findings: 20 21 22 23 24 25 26 27 28 29 30 ** HINT: use the data table 'trick' shown in lecture to create the 30 projected dividend values Complete a Monte Carlo simulation to evaluate Anticipated periodic destructions. Enter the NORM.INV() function in the specified INPUT cells to generate 30 random projected distribution values. (111:140) NOTE: The NORM.INV function should be entered into the INPUT cells.... NOT in the range 111:140 $100,000 Retirement Analysis of Projected Distributions INPUT AREA Pre-retirement Current retirement account balance Number of years contributing 30 Anticipated interest earned PRE-retirement (APR) 7.50% Periodic contribution amount $400 Contribution frequency 1 (Select 1 for monthly, enter 2 for semi-monthly, and 3 for weekly) Variable Years Contributing Contributing APR Years Withdrawing Mean Standard Deviation 30 4.3 7.50% 1.65% 25 5.8 When entering the NORM.INV() function into each of the 3 specified input cells, use the mean and standard deviation values given in the range G3:16 The 30 generated projected distribution values should be keyed into 111:140 Projected Distributions After entering the 30 output values, use the data analysis toolpak to create descriptive summary statistics and a histogram of the output distribution. Post-retirement: Number of years withdrawing 25 Anticipated interest earned post-retirement (APR) 4.50% Distribution frequency 2 (Select 1 for monthly, enter 2 for semi-monthly, and 3 for weekly) Trial 1 2 3 4 5 Include in cell K29 a 2 to 3 sentence summary of your simulation findings Assume you are running the simulation for a client and you want to provide a short overview of the results. Your summary should discuss at least 2 statistics produced by the analysis. Assume your client would like to receive a periodic distribution of $5,000 Does the client need to change any input assumptions to reach their goal? CALCULATIONS AREA Pre-retirement Periodic rate earned Number of periods Total account value at retirement 0.63% 360 $1,481,132 Post-retirement: Periodic rate earned Number of periods 6 7 8 9 10 11 12 13 14 15 16 17 18 19 0.19% 6001 OUTPUT AREA Anticipated periodic distribution (ie, payment) $4,114 Except for the input cells you need to modify, do NOT change any of the values in the retirement analysis Simulation Summary of findings: 20 21 22 23 24 25 26 27 28 29 30 ** HINT: use the data table 'trick' shown in lecture to create the 30 projected dividend values
Step by Step Solution
There are 3 Steps involved in it

Get step-by-step solutions from verified subject matter experts