

Question: Question: Please complete the Monte Carlo Simulation for 250 outcomes for NPV and complete all the tables below. Please show all formulas used. Thanks Monte
Question: Please complete the Monte Carlo Simulation for 250 outcomes for NPV and complete all the tables below. Please show all formulas used. Thanks
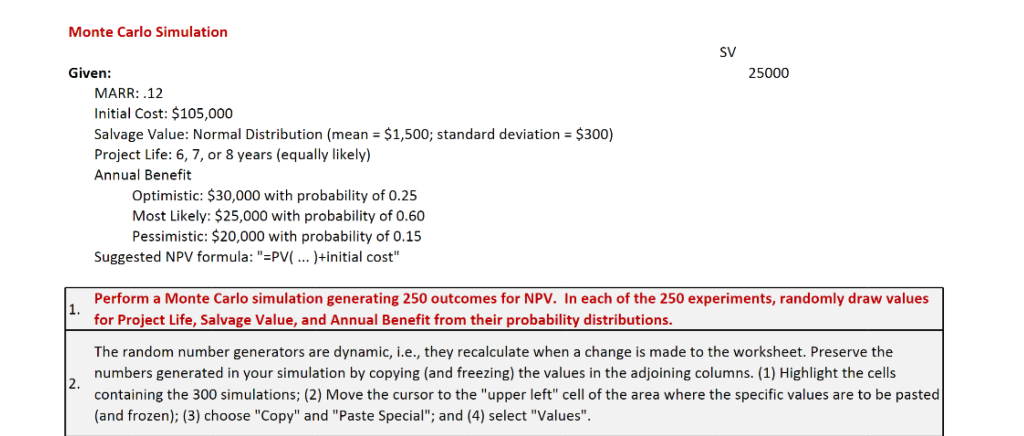
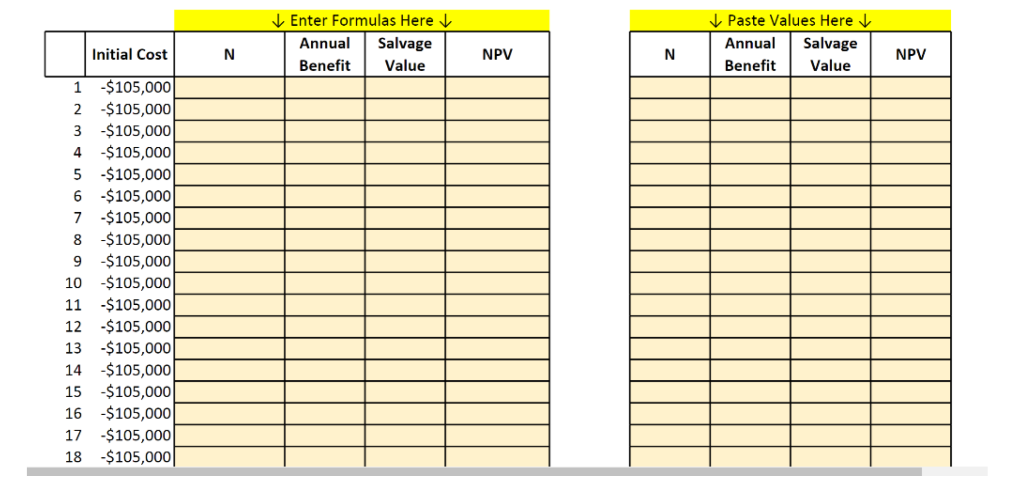
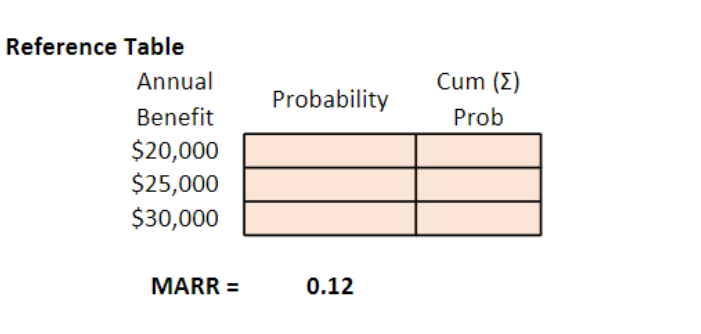
Monte Carlo Simulation SV 25000 Given: MARR: .12 Initial Cost: $105,000 Salvage Value: Normal Distribution (mean = $1,500; standard deviation = $300) Project Life: 6, 7, or 8 years (equally likely) Annual Benefit Optimistic: $30,000 with probability of 0.25 Most Likely: $25,000 with probability of 0.60 Pessimistic: $20,000 with probability of 0.15 Suggested NPV formula: "=PV( ... )+initial cost" 1. Perform a Monte Carlo simulation generating 250 outcomes for NPV. In each of the 250 experiments, randomly draw values for Project Life, Salvage Value, and Annual Benefit from their probability distributions. The random number generators are dynamic, i.e., they recalculate when a change is made to the worksheet. Preserve the numbers generated in your simulation by copying (and freezing) the values in the adjoining columns. (1) Highlight the cells containing the 300 simulations; (2) Move the cursor to the "upper left" cell of the area where the specific values are to be pasted (and frozen); (3) choose "Copy" and "Paste Special"; and (4) select "Values". 2. Enter Formulas Here Annual Salvage Benefit Value Paste Values Here Annual Salvage Benefit Value Initial Cost N NPV N NPV 1 2 3 4 5 6 7 8 9 10 11 12 -$105,000 $ 105,000 $ 105,000 $ 105,000 $ 105,000 $ 105,000 -$ 105,000 $ 105,000 $ 105,000 $ 105,000 $ 105,000 $ 105,000 -$105,000 $ 105,000 $ 105,000 $ 105,000 $105,000 -$105,000 13 14 15 16 17 18 Probability Cum (E) Prob Reference Table Annual Benefit $20,000 $25,000 $30,000 MARR = 0.12 Monte Carlo Simulation SV 25000 Given: MARR: .12 Initial Cost: $105,000 Salvage Value: Normal Distribution (mean = $1,500; standard deviation = $300) Project Life: 6, 7, or 8 years (equally likely) Annual Benefit Optimistic: $30,000 with probability of 0.25 Most Likely: $25,000 with probability of 0.60 Pessimistic: $20,000 with probability of 0.15 Suggested NPV formula: "=PV( ... )+initial cost" 1. Perform a Monte Carlo simulation generating 250 outcomes for NPV. In each of the 250 experiments, randomly draw values for Project Life, Salvage Value, and Annual Benefit from their probability distributions. The random number generators are dynamic, i.e., they recalculate when a change is made to the worksheet. Preserve the numbers generated in your simulation by copying (and freezing) the values in the adjoining columns. (1) Highlight the cells containing the 300 simulations; (2) Move the cursor to the "upper left" cell of the area where the specific values are to be pasted (and frozen); (3) choose "Copy" and "Paste Special"; and (4) select "Values". 2. Enter Formulas Here Annual Salvage Benefit Value Paste Values Here Annual Salvage Benefit Value Initial Cost N NPV N NPV 1 2 3 4 5 6 7 8 9 10 11 12 -$105,000 $ 105,000 $ 105,000 $ 105,000 $ 105,000 $ 105,000 -$ 105,000 $ 105,000 $ 105,000 $ 105,000 $ 105,000 $ 105,000 -$105,000 $ 105,000 $ 105,000 $ 105,000 $105,000 -$105,000 13 14 15 16 17 18 Probability Cum (E) Prob Reference Table Annual Benefit $20,000 $25,000 $30,000 MARR = 0.12
Step by Step Solution
There are 3 Steps involved in it

Get step-by-step solutions from verified subject matter experts