

Question: Complete a table of function values and hence draw the graph of the quadratic function. f (x) = X2 + 7x+ 10 on the interval
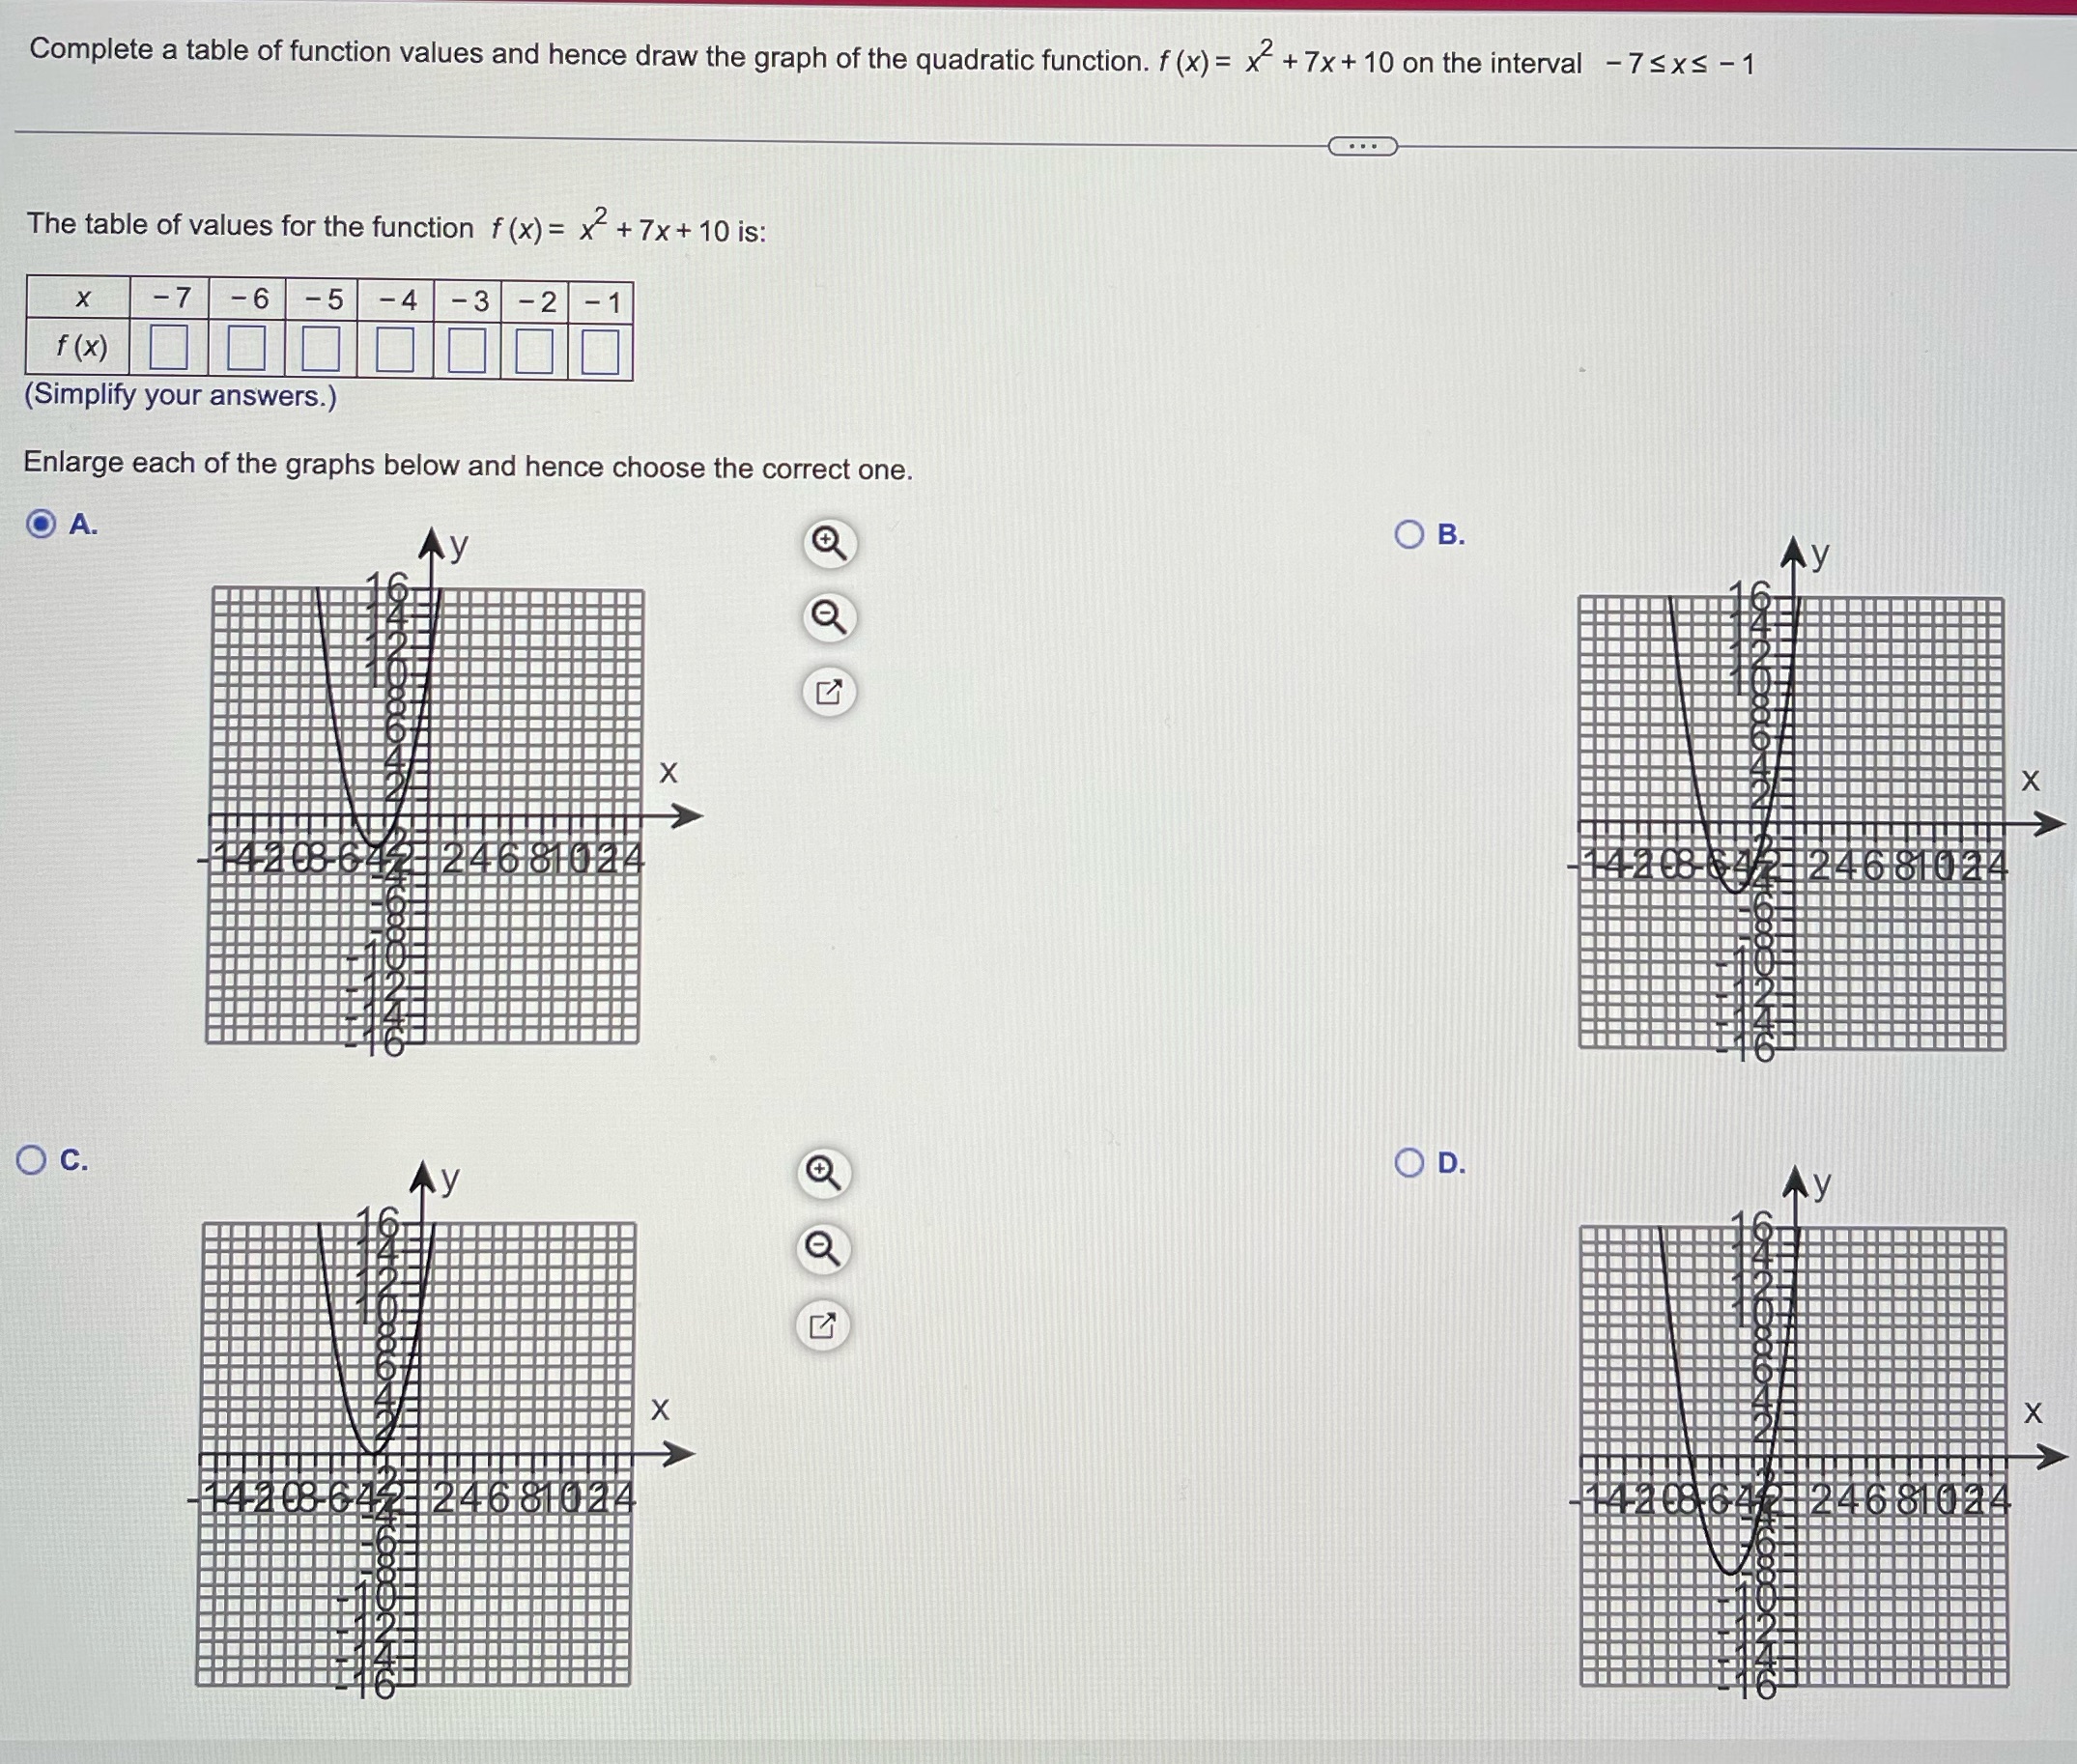

Complete a table of function values and hence draw the graph of the quadratic function. f (x) = X2 + 7x+ 10 on the interval 7 5 XS -1 (E The table of values for the function f (x) = x2 + 7x+ 10 is: (Simplify your answers.) Enlarge each of the graphs below and hence choose the correct one. (9 A. Q 0 B- Q Ill Ill :1- 'D
Step by Step Solution
There are 3 Steps involved in it
1 Expert Approved Answer
Step: 1 Unlock

Question Has Been Solved by an Expert!
Get step-by-step solutions from verified subject matter experts
Step: 2 Unlock
Step: 3 Unlock