

Question: Complete all parts sullillidry, and construct a box-whisker plot. 2. The following represent temperatures in the month of August here at NCC last year. 74
Complete all parts
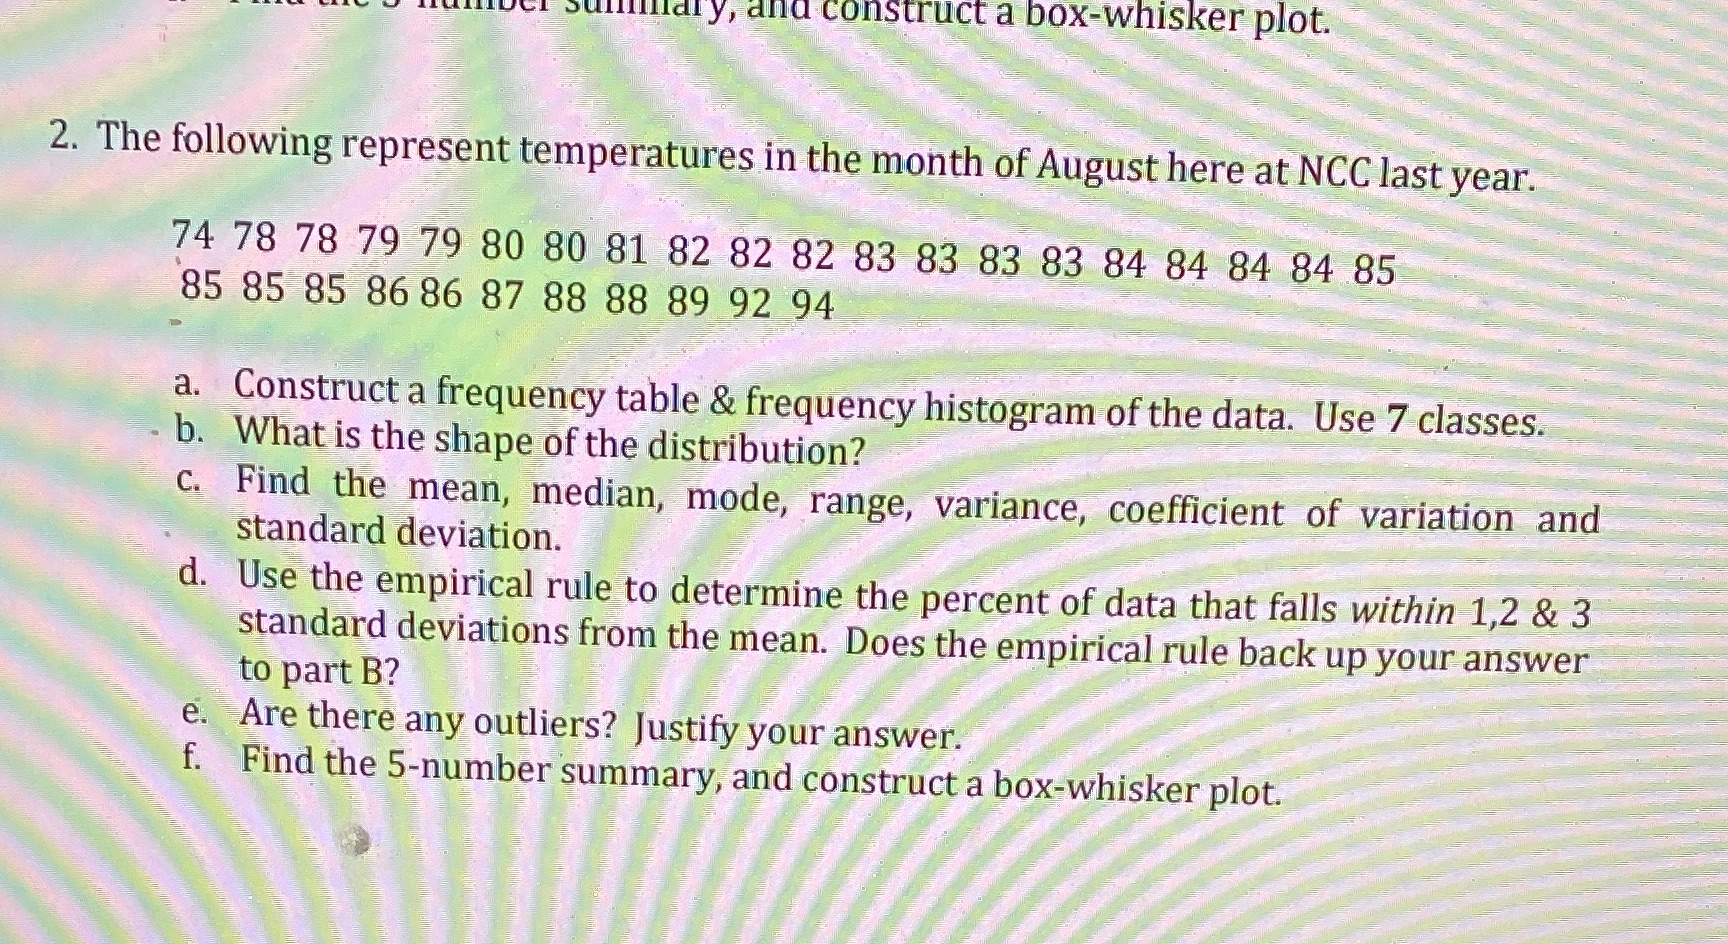
sullillidry, and construct a box-whisker plot. 2. The following represent temperatures in the month of August here at NCC last year. 74 78 78 79 79 80 80 81 82 82 82 83 83 83 83 84 84 84 84 85 85 85 85 86 86 87 88 88 89 92 94 a. Construct a frequency table & frequency histogram of the data. Use 7 classes. b. What is the shape of the distribution? c. Find the mean, median, mode, range, variance, coefficient of variation and standard deviation. d. Use the empirical rule to determine the percent of data that falls within 1,2 & 3 standard deviations from the mean. Does the empirical rule back up your answer to part B? e. Are there any outliers? Justify your answer. f. Find the 5-number summary, and construct a box-whisker plot
Step by Step Solution
There are 3 Steps involved in it

Get step-by-step solutions from verified subject matter experts