

Question: Complete and explain the table below. 2011 2012 2013 2014 2015 2016 2017 2018 2019 2020 2021 2022 2023 2024 Incremental Research 35 35 Incremental
Complete and explain the table below.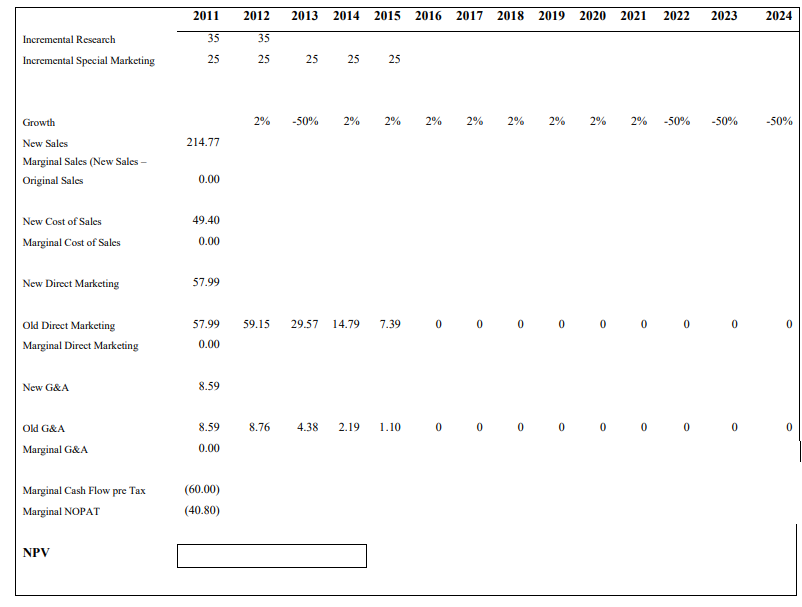
2011 2012 2013 2014 2015 2016 2017 2018 2019 2020 2021 2022 2023 2024 Incremental Research 35 35 Incremental Special Marketing 25 25 25 25 25 Growth 2% -50% 2% 2% 2% 2% 2% 2% 2% 2% -50% -50% -50% 214.77 New Sales Marginal Sales (New Sales - Original Sales 0.00 49.40 New Cost of Sales Marginal Cost of Sales 0.00 New Direct Marketing 57.99 57.99 59.15 29.57 14.79 7.39 0 0 0 0 0 0 0 0 Old Direct Marketing Marginal Direct Marketing 0.00 New G&A 8.59 Old G&A 8.59 8.76 4.38 2.19 1.10 0 0 0 0 0 0 0 0 Marginal G&A 0.00 Marginal Cash Flow pre Tax Marginal NOPAT (60.00) (40.80) NPV 2011 2012 2013 2014 2015 2016 2017 2018 2019 2020 2021 2022 2023 2024 Incremental Research 35 35 Incremental Special Marketing 25 25 25 25 25 Growth 2% -50% 2% 2% 2% 2% 2% 2% 2% 2% -50% -50% -50% 214.77 New Sales Marginal Sales (New Sales - Original Sales 0.00 49.40 New Cost of Sales Marginal Cost of Sales 0.00 New Direct Marketing 57.99 57.99 59.15 29.57 14.79 7.39 0 0 0 0 0 0 0 0 Old Direct Marketing Marginal Direct Marketing 0.00 New G&A 8.59 Old G&A 8.59 8.76 4.38 2.19 1.10 0 0 0 0 0 0 0 0 Marginal G&A 0.00 Marginal Cash Flow pre Tax Marginal NOPAT (60.00) (40.80) NPV
Step by Step Solution
There are 3 Steps involved in it

Get step-by-step solutions from verified subject matter experts