

Question: complete everything and please use the alphabets accordingly .am not sure about this topic . TASK 2 Recently, the annual number of driver deaths per
complete everything and please use the alphabets accordingly .am not sure about this topic .
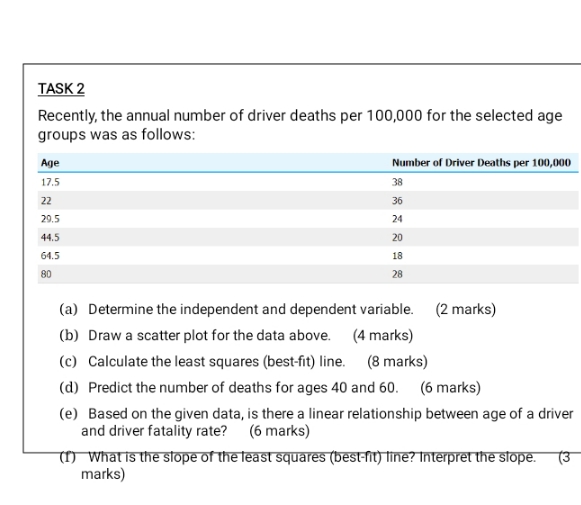
TASK 2 Recently, the annual number of driver deaths per 100,000 for the selected age groups was as follows: Age Number of Driver Deaths per 100,000 17.5 38 22 36 29.5 24 44.5 20 61.5 18 80 28 (a) Determine the independent and dependent variable. (2 marks) (b) Draw a scatter plot for the data above. (4 marks) (c) Calculate the least squares (best-fit) line. (8 marks) (d) Predict the number of deaths for ages 40 and 60. (6 marks) (e) Based on the given data, is there a linear relationship between age of a driver and driver fatality rate? (6 marks) (I) What is the slope of the least squares (best-fit) line? Interpret the slope
Step by Step Solution
There are 3 Steps involved in it

Get step-by-step solutions from verified subject matter experts