

Question: Complete Exercise 19-4: Pareto Rule, found in the Examples & Exercises Section, Chapter 19 (pg566). This can be done in Excel using the Insert menu
Complete Exercise 19-4: Pareto Rule, found in the Examples & Exercises Section, Chapter 19 (pg566). This can be done in Excel using the Insert menu and selecting Charts. You must first set up your data in Excel as shown in Figure 19-4 (pg 230). In Excel, the percentages must be written as cumulative, rather than the percentage that each process represents of the whole. Be certain that you answer question #2, in addition to completing the graph.
Example page 230:
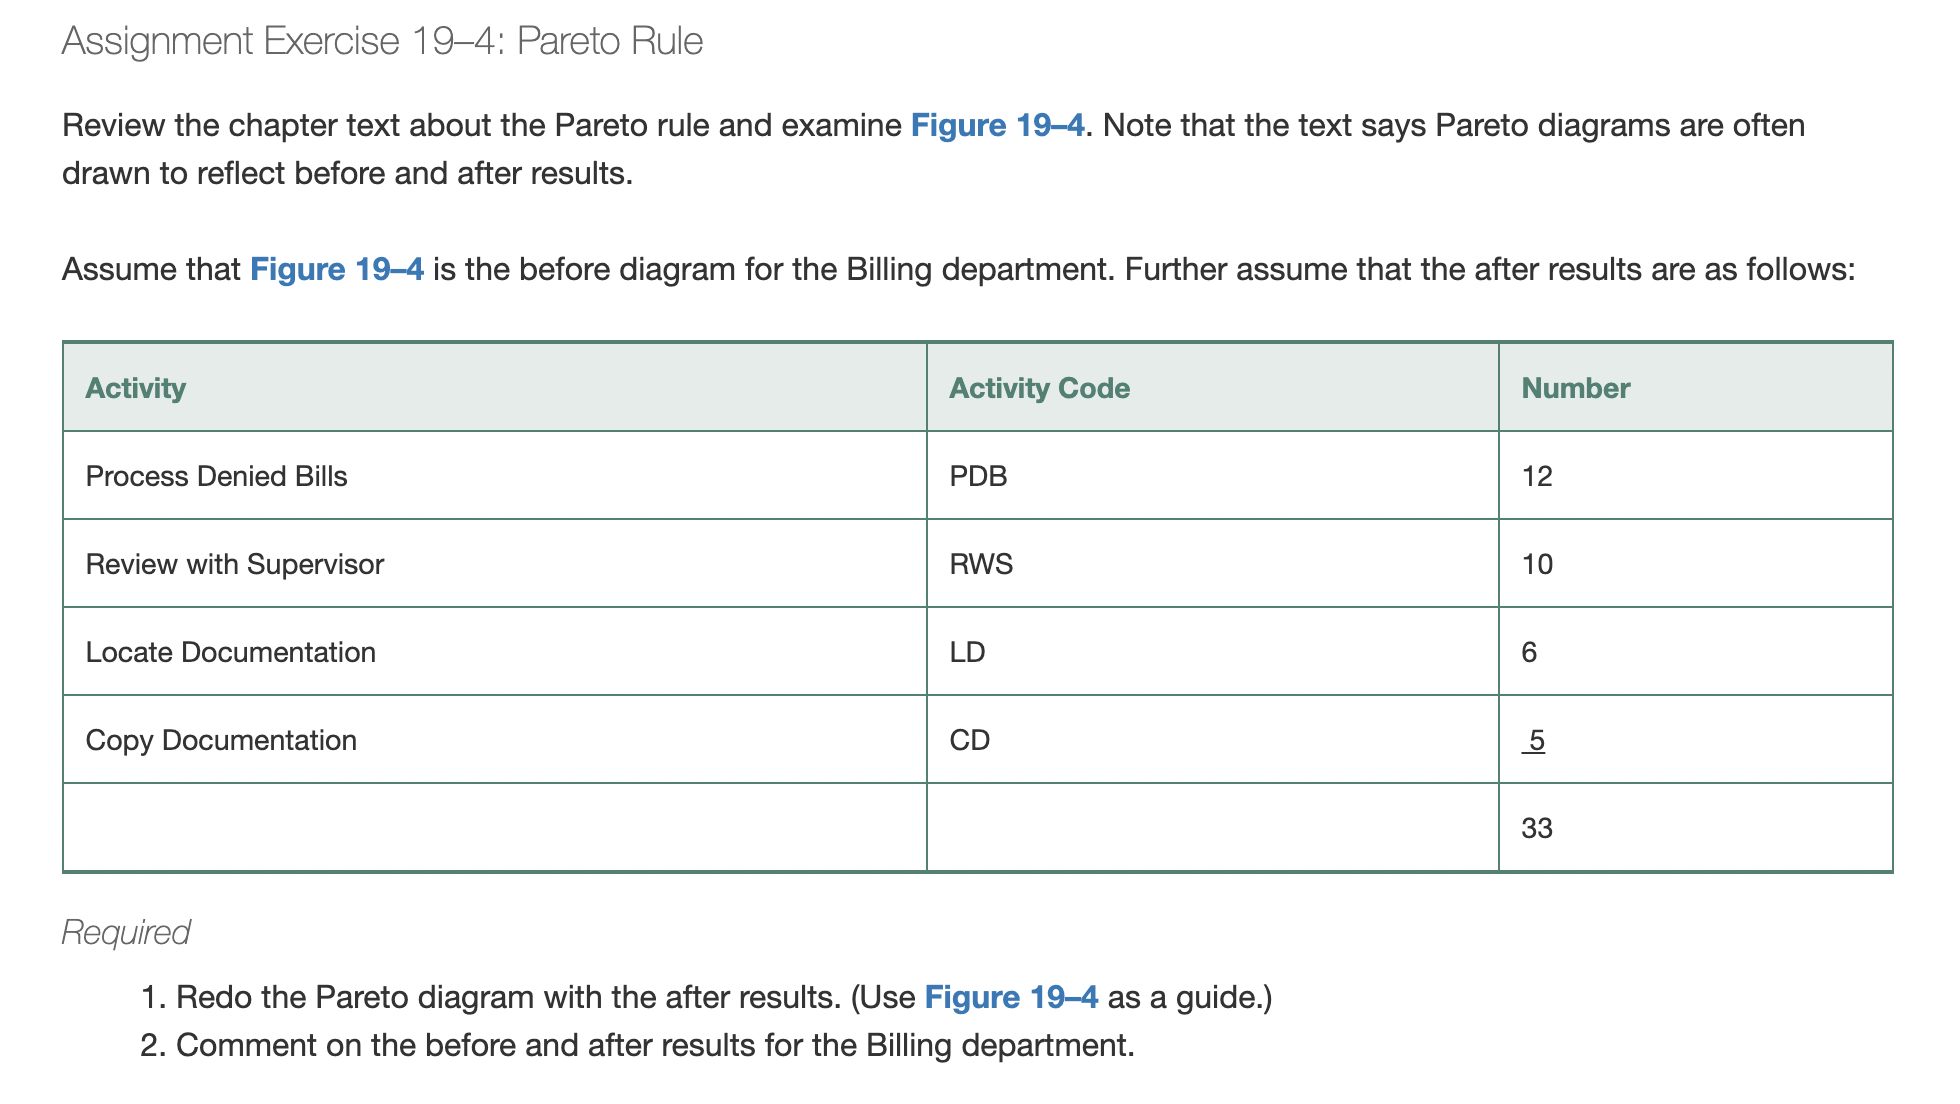
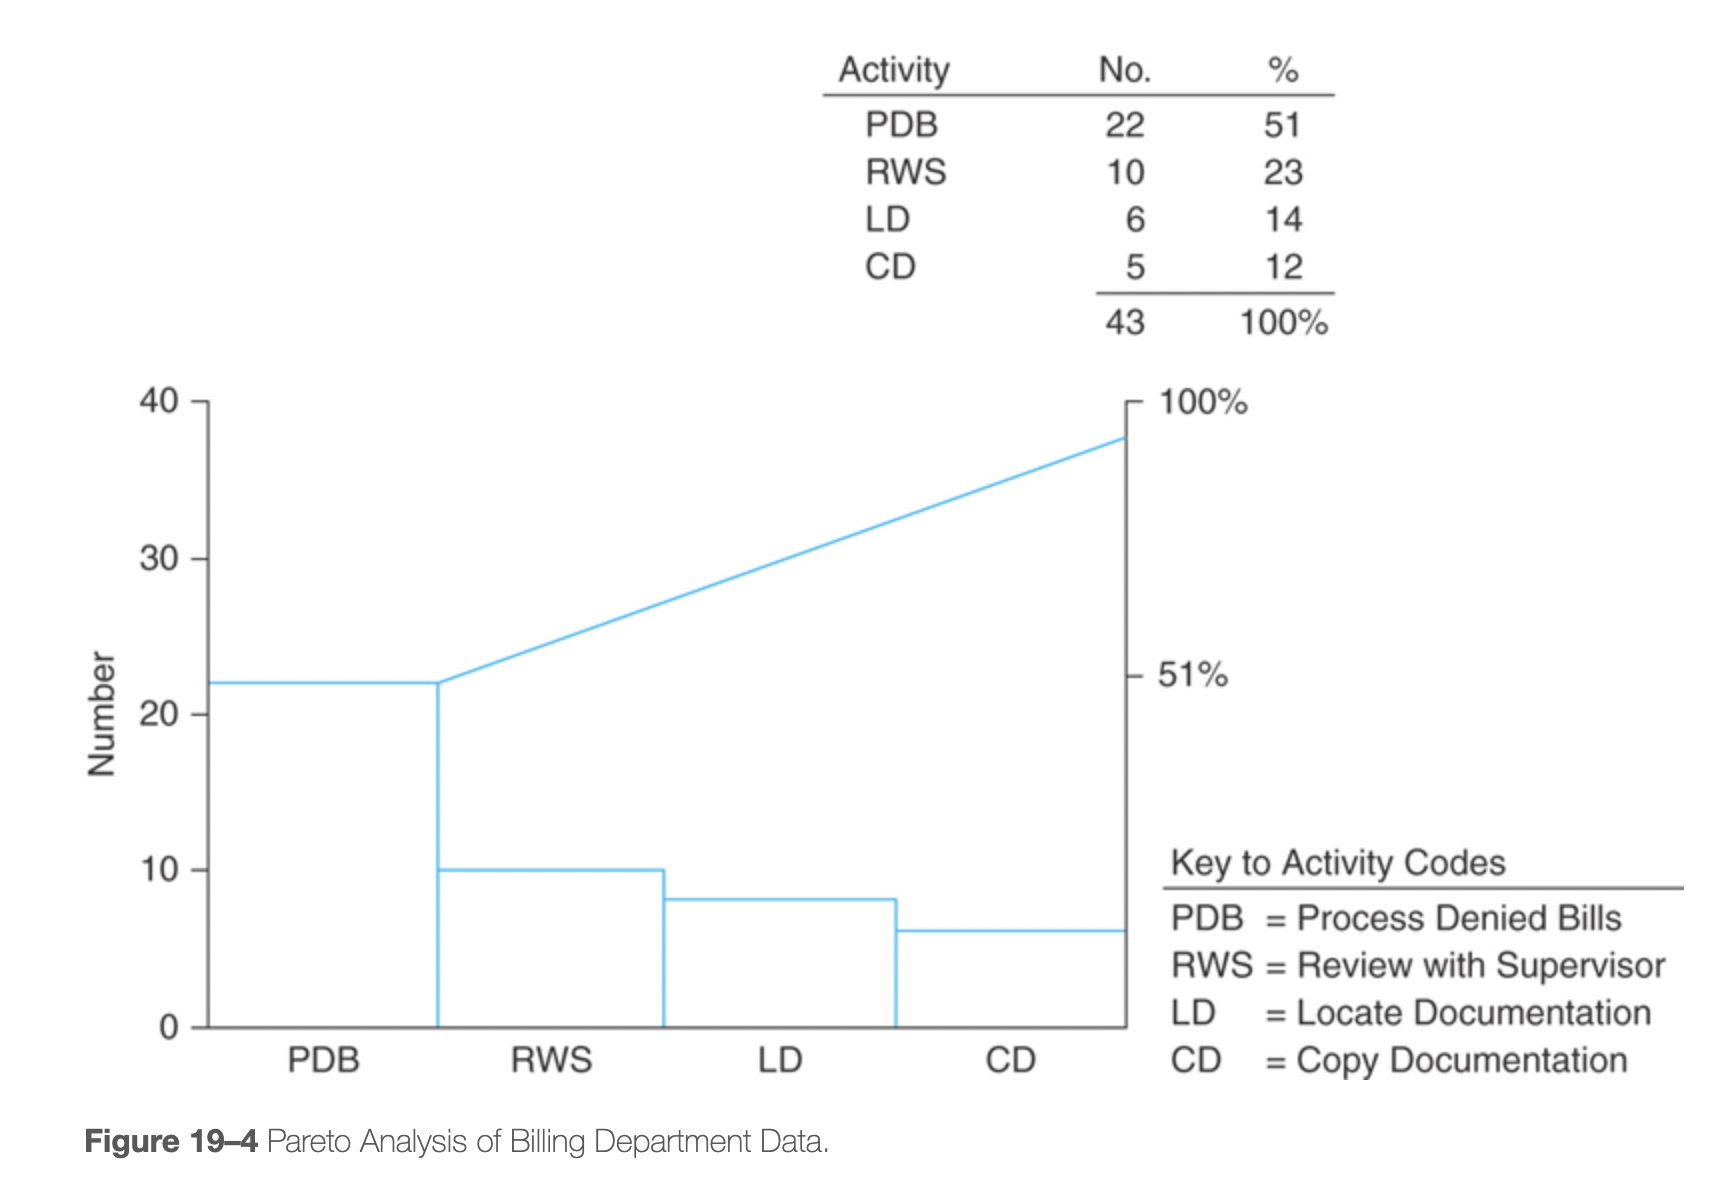
Assignment Exercise 194: Pareto Rule Review the chapter text about the Pareto rule and examine Figure 194. Note that the text says Pareto diagrams are often drawn to reflect before and after results. Assume that Figure 194 is the before diagram for the Billing department. Further assume that the after results are as follows: Activity Activity Code Number Process Denied Bills PDB 12 Review with Supervisor RWS 10 Locate Documentation LD 6 Copy Documentation CD _5 33 Required 1. Redo the Pareto diagram with the after results. (Use Figure 19-4 as a guide.) 2. Comment on the before and after results for the Billing department. Activity No. % PDB 22 51 RWS 10 23 LD 6 14 CD 5 12 43 100% 40 100% 30 51% Number 20 10 Key to Activity Codes PDB = Process Denied Bills RWS = Review with Supervisor 0 LD = Locate Documentation PDB RWS LD CD CD = Copy Documentation Figure 19-4 Pareto Analysis of Billing Department Data
Step by Step Solution
There are 3 Steps involved in it

Get step-by-step solutions from verified subject matter experts