Question: Assignment Content Please complete Assignment Exercise 19.4: Pareto Rule found at the bottom of page 566. This can be done in Excel using the Insert
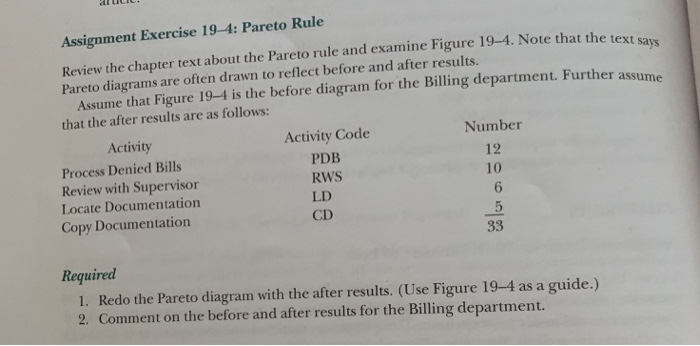
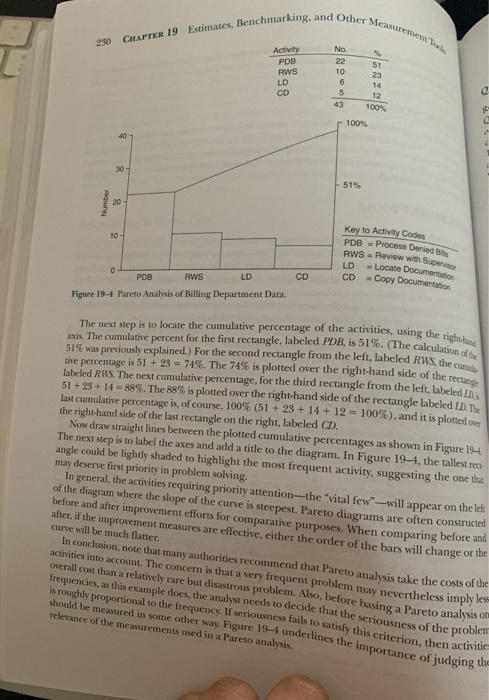
Assignment Content Please complete Assignment Exercise 19.4: Pareto Rule found at the bottom of page 566. This can be done in Excel using the Insert menu and selecting Charts. You must first set up your data in Excel as shown at the top pf page 230. Except you should express the percentages as cumulative, rather than the percentage that each process represents of the whole It can be very challenging to complete this assignment in excel, please give it a try, but in the end, feel free to draw this by hand and submit a scan or photo of your work. 21 LILIL. te that the text says Assignment Exercise 19-4: Pareto Rule Review the chapter text about the Pareto rule and examine Figure 19-4. Note that the tex Pareto diagrams are often drawn to reflect before and after results. Assume that Figure 1944 is the before diagram for the Billing department. Further assu that the after results are as follows: Activity Code Number Process Denied Bills PDB Review with Supervisor Locate Documentation Copy Documentation Activity RWS LD Required 1. Redo the Pareto diagram with the after results. (Use Figure 19-4 as a guide.) 2. Comment on the before and after results for the Billing department. and Other Mea 250 CHAPTER 19 Estimates, Benchmarking and No. Activity PDB RWS 10 CD 5 12 100% r 100% 519 Number Key to Activity Codes PDB = Process Denied B RWS = Review with Super LD Locate Documentation CD -Copy Documentation POB RWS LD C D Figure 19-4 Pareto Analysis of Billing Department Data. The calculation be RWS, the cum The next step is to locate the cumulative percentage of the activities, using the axis. The cumulative percent for the first rectangle, labeled PDB, is 51%. (The calculas the 515 was previously explained.) For the second rectangle from the left, labeled R tive percentage is 51 + 23 = 74%. The 74% is plotted over the right-hand side of the rest Labeled RWS The next cumulative percentage, for the third rectangle from the left, labeled in 51 +23+ 14 = 88%. The 88% is plotted over the right-hand side of the rectangle labeled LD, Last cumulative percentage is, of course, 100% (51 +23+ 14 + 12 = 100%), and it is plotted the right-hand side of the last rectangle on the right, labeled CD. Now draw straight lines between the plotted cumulative percentages as shown in Figure 194 The next step is to label the axes and add a title to the diagram. In Figure 19-4. the tallest te angle could be lightly shaded to highlight the most frequent activity, suggesting the one that may deserve first priority in problem solving. In general, the activities requiring priority attention the "vital few will appear on the left of the diagram where the slope of the curve is steepest. Pareto diagrams are often constructed before and after improvement efforts for comparative purposes. When comparing before and alter, if the improvement measures are effective, either the order of the bars will change or the curve will be much flatter. requencies, as this relatively rare but that a very free roughly proportional ple docs, the anal problem. Also, befon may nevertheless impla relevance of the Fed in some other hey. If seriousness focide that the kising a Paretoa rements used in Figure 1944 underlo satisfy this cousness of the problem In conclusion, note that many authorities recommend that Pareto analysis take the costs of the activities into account. The concern is that a very frequent problem may nevertheless imply les overall cost than a relatively rare but disastrous problem. Also, before basing a Pareto analysis frequencies, as this example does, the analyst needs to decide that the seriousness of the problem is roughly proportional to the frequency. If seriousness fails to satisfy this should be measured in some other way. Figure 1944 underlines the in this criterion, then activitie relevance of the measurements used in a Pareto analysis. he importance of judging the ECOKUS Other performance me example of a widespre the performance of lo about their ability to ce measures may be made outside the actual confines of the facility. A good spread performance measure would be the role of community hospitals in of local economies. Nonprofit organizations in particular are concerned Wility to measure such performance. This case study gives a specific direction for auch measurement efforts MEASUREMENT TOOLS ht con of Pareto Analysis Creating benchmarks improvement, ultimately lead the State ared with Low On 900 benchmarks, especially in an organization committed to continuous quality ent, ultimately leads managers to explore how to improve some step in a process analysis is an analytical tool that employs the Pareto principle and helps in this explora- Pareto was a 19th-century economist who was a pioneer in applying mathematics to co mic theory. His Pareto principle states that 80% of an organization's problems, for example, caused by 20% of the possible causes: thus the "80/20 Rule." The usual way to display a Pareto analysis is through the construction of a Pareto diagram. A Pareto diagram displays the important causes of variation, as reflected in data collected on the causes of such variation Figure 1944 presents an example of a Pareto diagram. This example reinforces the idea behind the Pareto analysis that the majority of problems are due to a small number of identifiable causes. The chief financial officer of XYZZ. Hospital believes that the billing and collection department is inefficient or, to be more specific, that the process is probably inefficient. An activity analysis is conducted. It shows that billing personnel are spending too much time on unproductive work. This Pareto diagram displays the activities involved in resubmitting denied bills. (Resubmitting denied bills is an inefficient and nonproductive activity, as we have dis- cussed in a preceding chapter.) Constructing a Pareto diagram is really simple. The first step is to prepare a table that shows the activities recorded, the number of times the activities were observed, and the percentage of the total number of times represented by each count. In Figure 19-4, the total number of times these activities were observed is 43. The number of times that processing denied bills for 51%. Similar calcula- resubmission (coded as PDB) was observed is 22. Thus, 100 (22/43) tions complete the table. The table of observations is shown in its entirety within the figure. The Pareto diagram has two vertical axes, the left one corresponding to the "No." column in the table, the right one corresponding to the "%" column in the table. On the horizontal axis, the activities are listed, creating bases of equal length for the rectangles shown in the diagram. The activities are listed in decreasing order of occurrence, Constructing the diagram in this manner means that the most frequently observed activity lies on the left extreme of the diagram and the least frequently observed activity on the right extreme. The heights of the rectangles are drawn to show the frequencies of the activities, and then the sides of the rectangle are drawn. 50.4