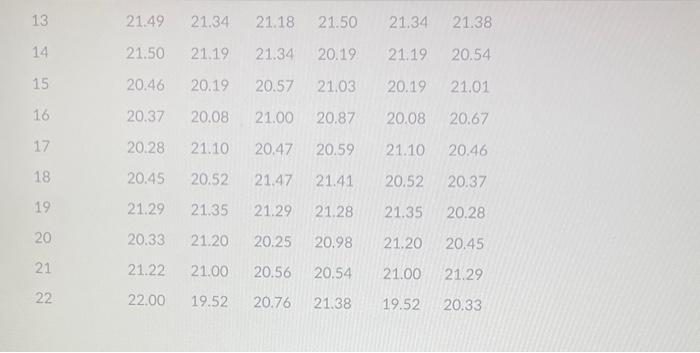
Question: complete in excel/ diagram Use the following data to construct one mean (x-barl chart and one range chart (R-chart), Is the process in control? Note

complete in excel/ diagram complete in excel/ diagram Use the following data
complete in excel/ diagram Use the following data
Use the following data to construct one mean (x-barl chart and one range chart (R-chart), Is the process in control? Note that a,b,c,d,e& f represent observations. \begin{tabular}{llllllll} 13 & 21.49 & 21.34 & 21.18 & 21.50 & 21.34 & 21.38 \\ \hline 14 & 21.50 & 21.19 & 21.34 & 20.19 & 21.19 & 20.54 \\ 15 & 20.46 & 20.19 & 20.57 & 21.03 & 20.19 & 21.01 \\ \hline 16 & 20.37 & 20.08 & 21.00 & 20.87 & 20.08 & 20.67 \\ 17 & 20.28 & 21.10 & 20.47 & 20.59 & 21.10 & 20.46 \\ 18 & 20.45 & 20.52 & 21.47 & 21.41 & 20.52 & 20.37 \\ 19 & 21.29 & 21.35 & 21.29 & 21.28 & 21.35 & 20.28 \\ \hline 20 & 20.33 & 21.20 & 20.25 & 20.98 & 21.20 & 20.45 \\ \hline 21 & 21.22 & 21.00 & 20.56 & 20.54 & 21.00 & 21.29 \\ \hline 22 & 22.00 & 19.52 & 20.76 & 21.38 & 19.52 & 20.33 \end{tabular}

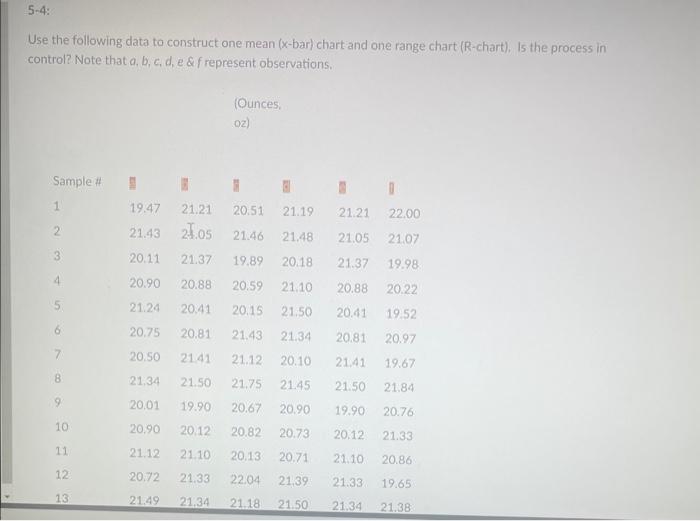
Step by Step Solution

There are 3 Steps involved in it

1 Expert Approved Answer
Step: 1 Unlock blur-text-image
Question Has Been Solved by an Expert!

Get step-by-step solutions from verified subject matter experts

Step: 2 Unlock
Step: 3 Unlock

Students Have Also Explored These Related General Management Questions!