

Question: Complete in MATLAB script 1) Using the equation of a straight line, y-m x+b, compute the y-coordinates of a line with slope m-0.5 and intercept
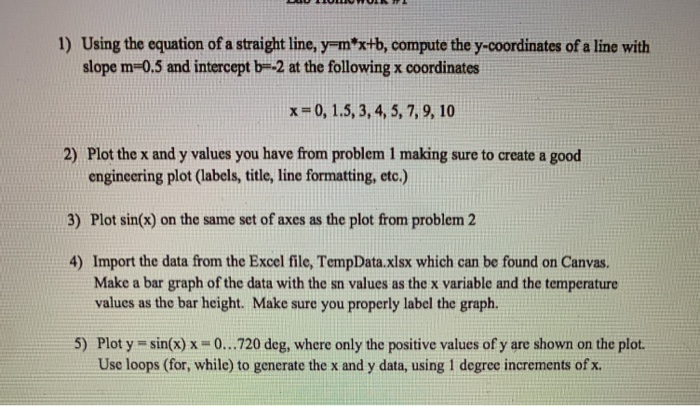
1) Using the equation of a straight line, y-m x+b, compute the y-coordinates of a line with slope m-0.5 and intercept b--2 at the following x coordinates x 0, 1.5,3, 4, 5, 7,9, 10 2) Plot the x and y values you have from problem 1 making sure to create a good engineering plot (labels, title, line formatting, etc.) 3) Plot sin(x) on the same set of axes as the plot from problem 2 4) Import the data from the Excel file, TempData.xlsx which can be found on Canvas. Make a bar graph of the data with the sn values as the x variable and the temperature values as the bar height. Make sure you properly label the graph. 5) Plot y sin(x) x-0...720 deg, where only the positive values of y are shown on the plot Use loops (for, while) to generate the x and y data, using 1 degree increments of x
Step by Step Solution
There are 3 Steps involved in it

Get step-by-step solutions from verified subject matter experts