

Complete one paragraph, profiling each company's business, including information such as brief histories, where each company...
Fantastic news! We've Found the answer you've been seeking!
Question:
Transcribed Image Text:
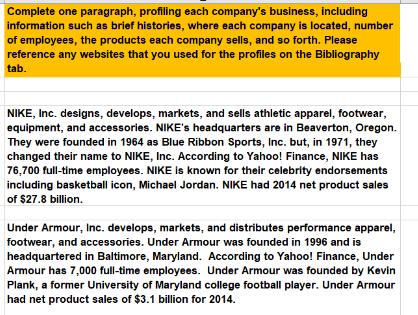
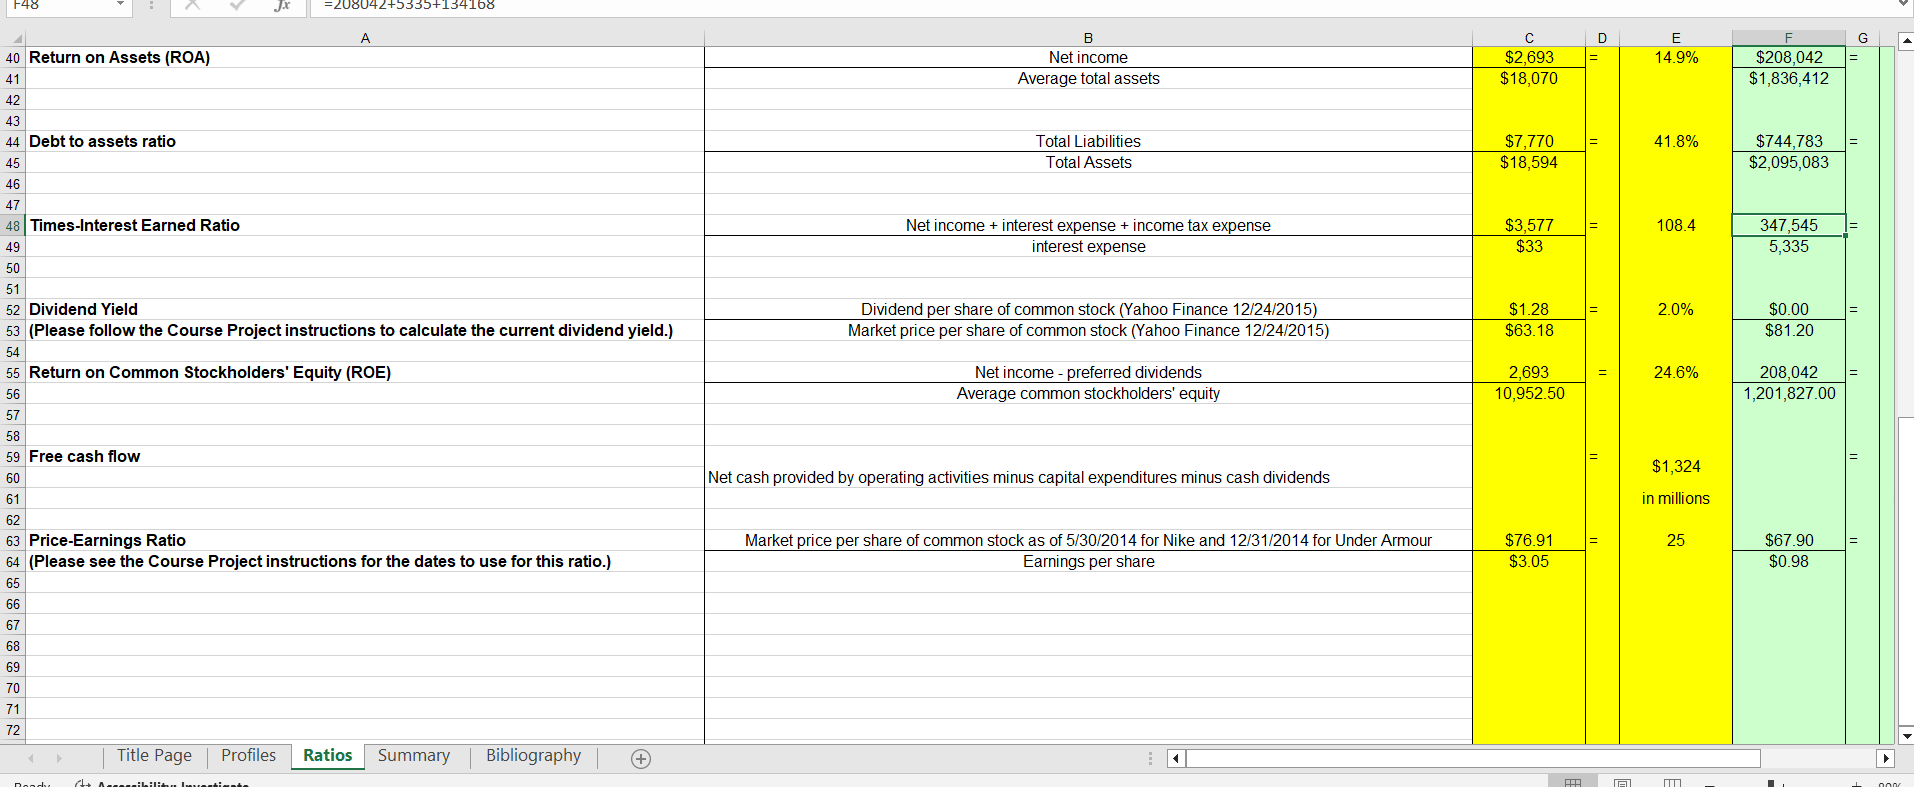
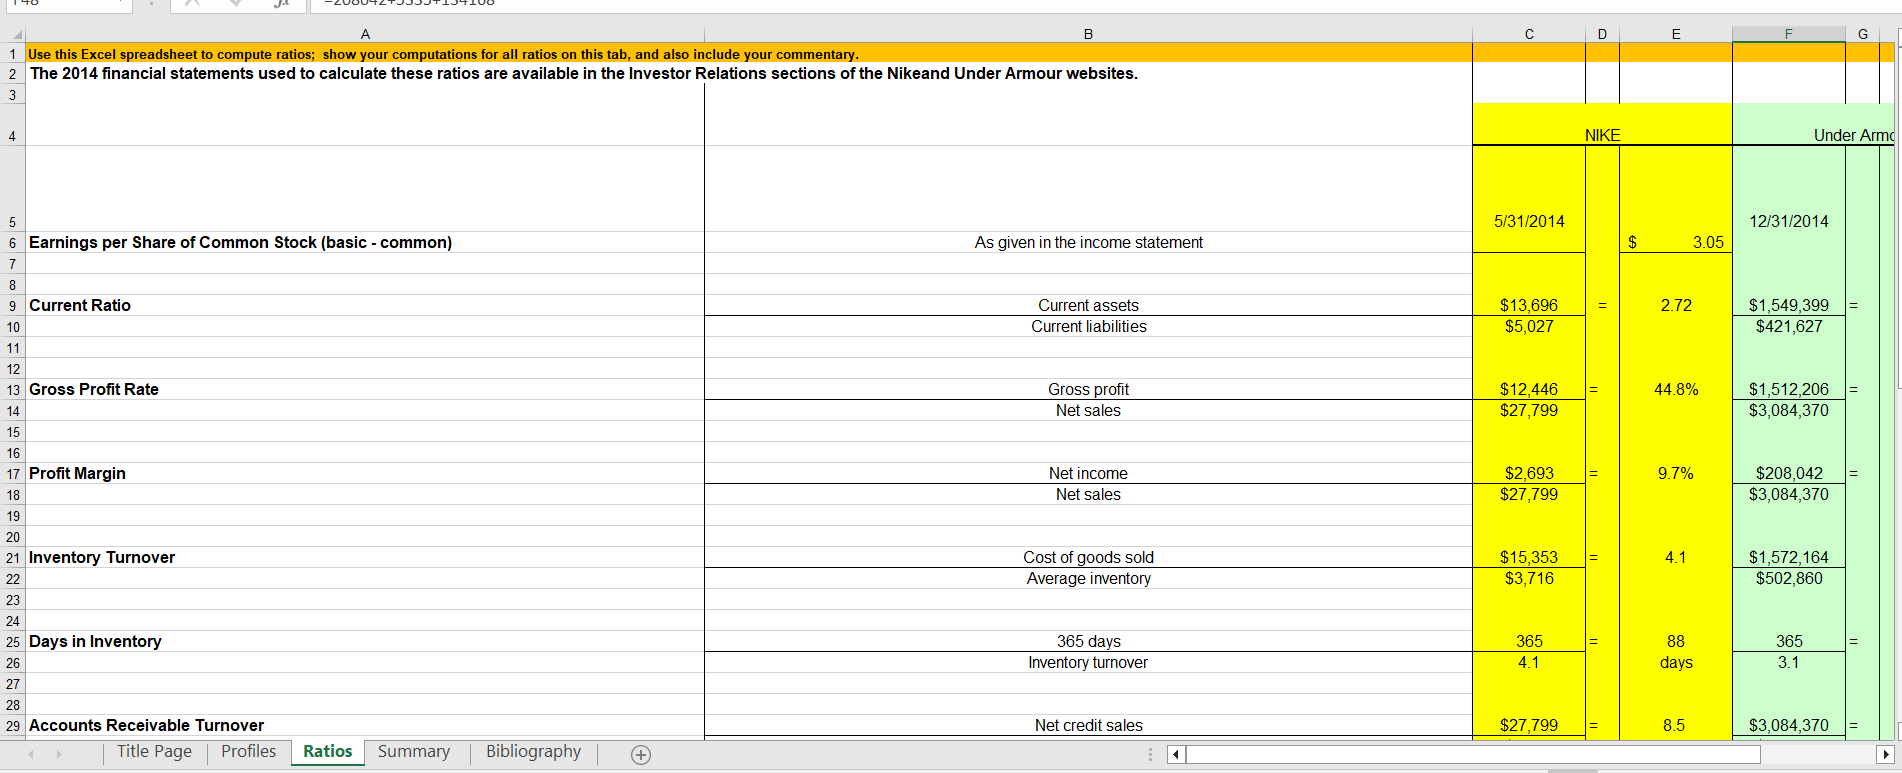
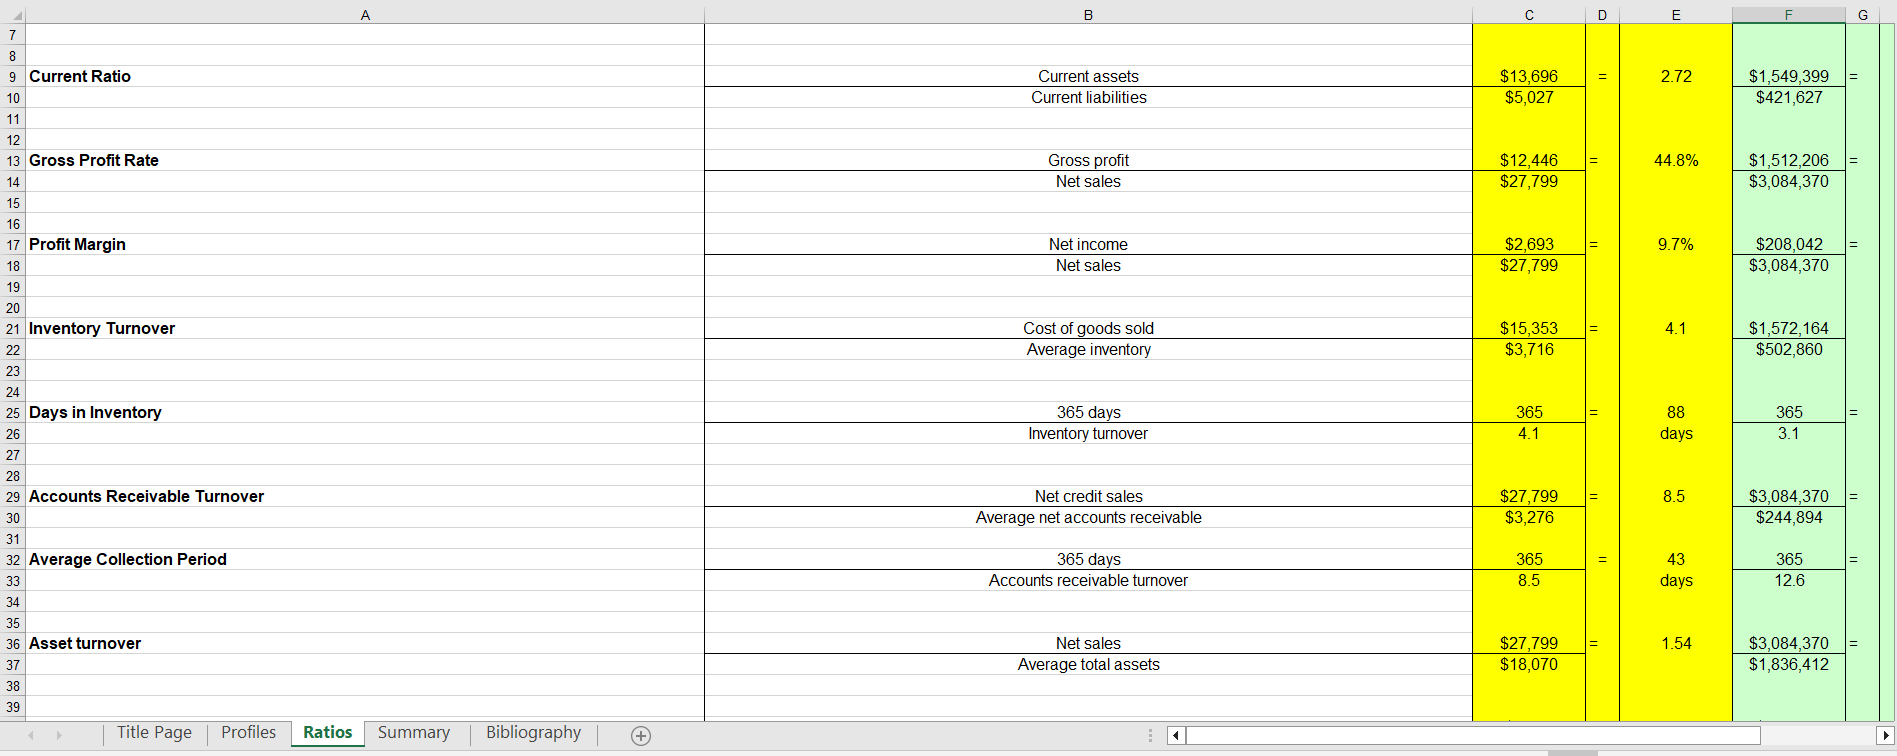
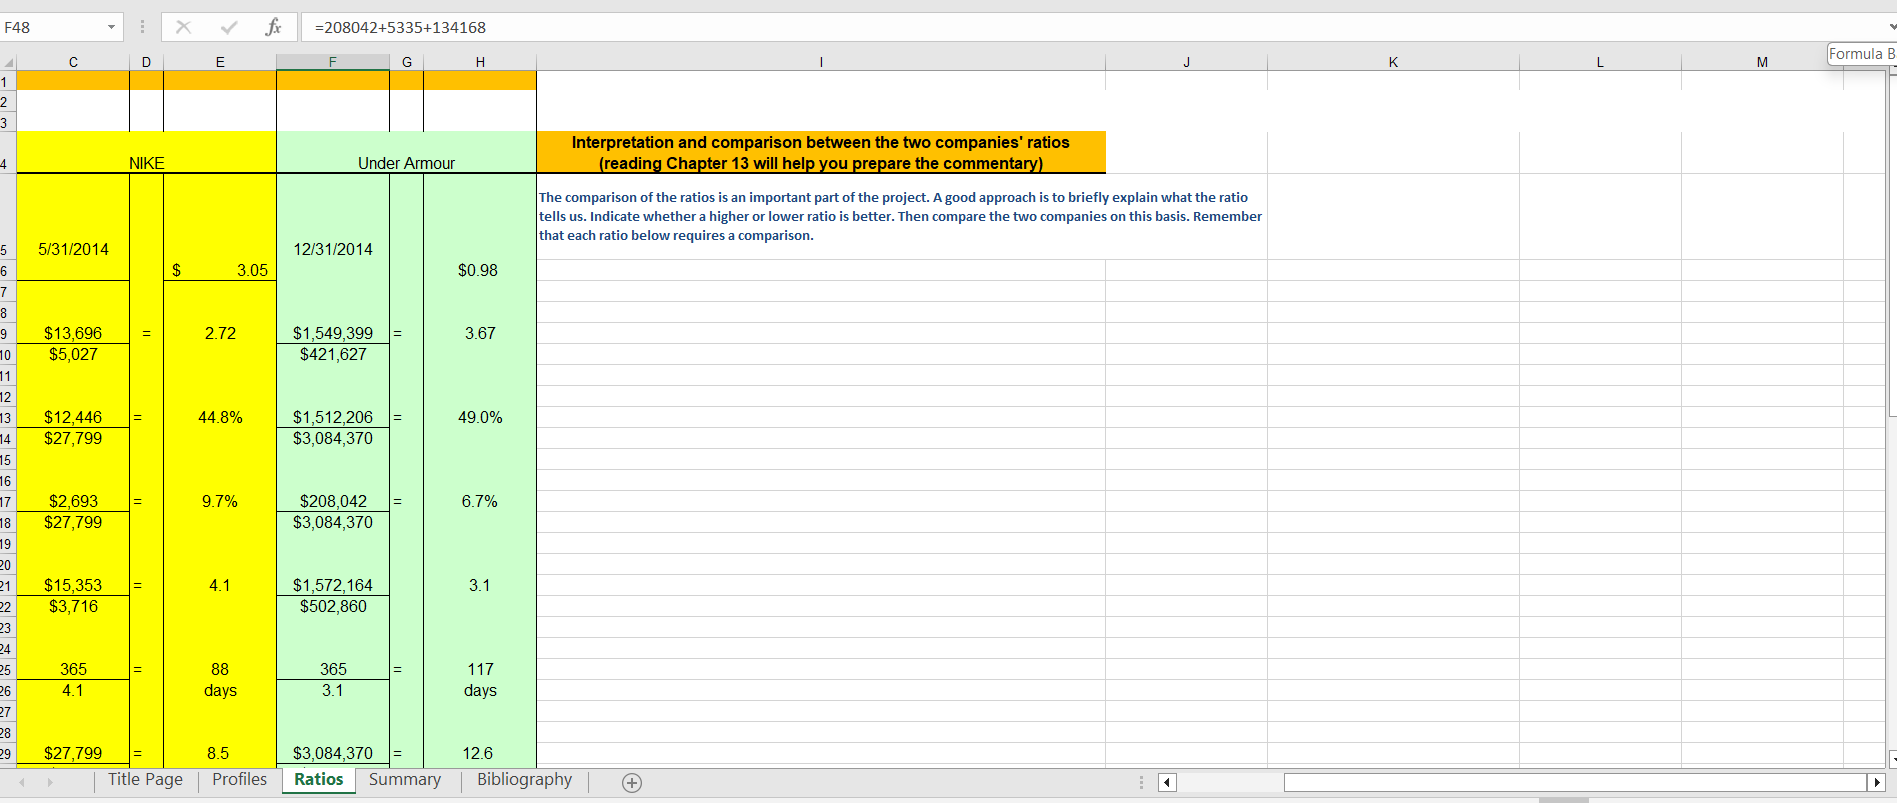
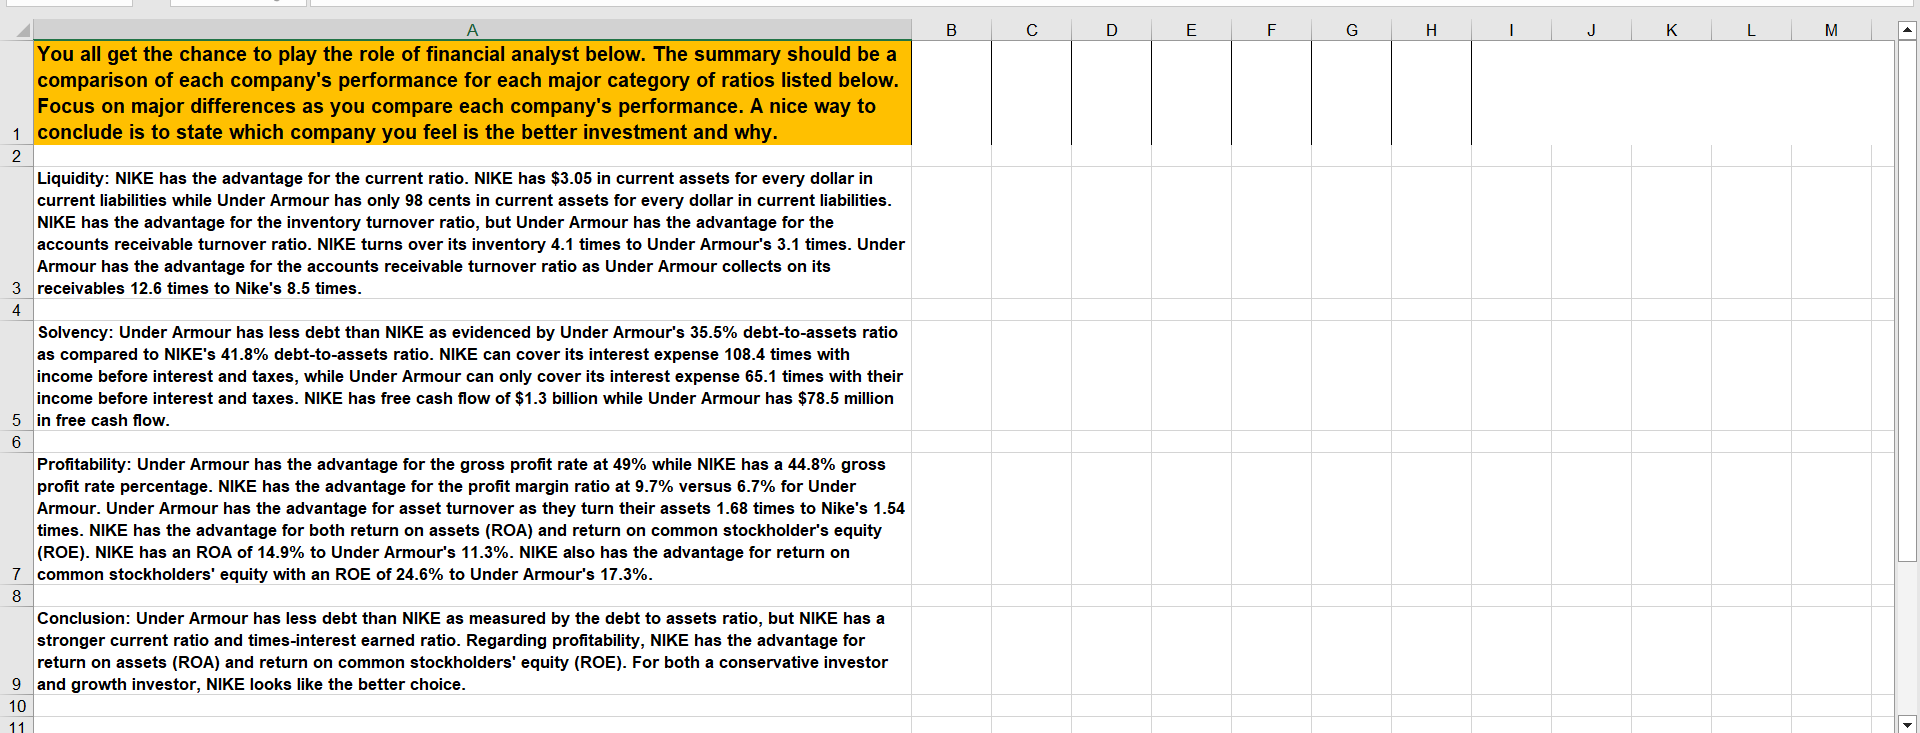
Complete one paragraph, profiling each company's business, including information such as brief histories, where each company is located, number of employees, the products each company sells, and so forth. Please reference any websites that you used for the profiles on the Bibliography tab. NIKE, Inc. designs, develops, markets, and sells athletic apparel, footwear, equipment, and accessories. NIKE's headquarters are in Beaverton, Oregon. They were founded in 1964 as Blue Ribbon Sports, Inc. but, in 1971, they changed their name to NIKE, Inc. According to Yahoo! Finance, NIKE has 76,700 full-time employees. NIKE is known for their celebrity endorsements including basketball icon, Michael Jordan. NIKE had 2014 net product sales of $27.8 billion. Under Armour, Inc. develops, markets, and distributes performance apparel, footwear, and accessories. Under Armour was founded in 1996 and is headquartered in Baltimore, Maryland. According to Yahoo! Finance, Under Armour has 7,000 full-time employees. Under Armour was founded by Kevin Plank, a former University of Maryland college football player. Under Armour had net product sales of $3.1 billion for 2014. F48 40 Return on Assets (ROA) 41 42 43 44 Debt to assets ratio 45 46 47 48 Times-Interest Earned Ratio 49 50 51 Jx =208042+5335+134168 A B Net income Average total assets Total Liabilities Total Assets Net income + interest expense + income tax expense interest expense C D $2,693 $18,070 E 14.9% $208,042 $1,836,412 $7,770 $18,594 41.8% $744,783 $2,095,083 $3,577 $33 108.4 347,545 5,335 52 Dividend Yield 53 (Please follow the Course Project instructions to calculate the current dividend yield.) Dividend per share of common stock (Yahoo Finance 12/24/2015) Market price per share of common stock (Yahoo Finance 12/24/2015) $1.28 2.0% $0.00 $63.18 $81.20 54 55 Return on Common Stockholders' Equity (ROE) 56 57 58 Net income - preferred dividends Average common stockholders' equity 2,693 10,952.50 24.6% 208,042 1,201,827.00 59 Free cash flow 60 61 62 63 Price-Earnings Ratio 64 (Please see the Course Project instructions for the dates to use for this ratio.) 65 66 67 68 69 70 71 72 Title Page Profiles Ratios Summary Bibliography Deady $1,324 Net cash provided by operating activities minus capital expenditures minus cash dividends in millions Market price per share of common stock as of 5/30/2014 for Nike and 12/31/2014 for Under Armour Earnings per share $76.91 $3.05 25 $67.90 $0.98 | A 1 Use this Excel spreadsheet to compute ratios; show your computations for all ratios on this tab, and also include your commentary. 2 The 2014 financial statements used to calculate these ratios are available in the Investor Relations sections of the Nikeand Under Armour websites. 3 4 56986 7 6 Earnings per Share of Common Stock (basic - common) 9 Current Ratio 10 11 12 13 Gross Profit Rate 14 15 16 17 Profit Margin 18 19 20 21 Inventory Turnover 22 23 24 25 Days in Inventory 26 27 28 29 Accounts Receivable Turnover Title Page D E G NIKE Under Armo 5/31/2014 12/31/2014 As given in the income statement $ 3.05 Current assets Current liabilities $13,696 $5,027 2.72 $1,549,399 $421,627 Gross profit $12,446 44.8% Net sales $27,799 $1,512,206 $3,084,370 Net income Net sales $2,693 9.7% $208,042 $27,799 $3,084,370 Cost of goods sold $15,353 4.1 Average inventory $3,716 $1,572,164 $502,860 365 days Inventory turnover 365 4.1 88 days 365 3.1 Net credit sales $27,799 8.5 $3,084,370 Profiles Ratios Summary Bibliography (+) 7 8 9 Current Ratio 10 11 12 13 Gross Profit Rate 14 15 16 17 Profit Margin 18 19 20 21 Inventory Turnover 22 23 24 25 Days in Inventory 26 27 28 29 Accounts Receivable Turnover 30 31 32 Average Collection Period 33 34 35 36 Asset turnover 37 38 39 Title Page Profiles Ratios Summary Bibliography B C D E Current assets $13,696 = 2.72 Current liabilities $5,027 $1,549,399 $421,627 Gross profit $12,446 44.8% Net sales $27,799 $1,512,206 $3,084,370 Net income Net sales $2,693 9.7% $27,799 $208,042 $3,084,370 Cost of goods sold Average inventory $15,353 $3,716 4.1 $1,572,164 $502,860 365 days Inventory turnover 365 4.1 88 days 365 3.1 Net credit sales $27,799 8.5 Average net accounts receivable $3,276 $3,084,370 $244,894 365 days 365 43 365 Accounts receivable turnover 8.5 days 12.6 Net sales Average total assets $27,799 1.54 $3,084,370 $18,070 $1,836,412 G 1 2 3 F48 D E 4 NIKE fx =208042+5335+134168 F G H Under Armour Interpretation and comparison between the two companies' ratios (reading Chapter 13 will help you prepare the commentary) The comparison of the ratios is an important part of the project. A good approach is to briefly explain what the ratio tells us. Indicate whether a higher or lower ratio is better. Then compare the two companies on this basis. Remember that each ratio below requires a comparison. 5 5/31/2014 12/31/2014 6 $ 3.05 $0.98 7 8 9 $13,696 = 2.72 10 $5,027 $1,549,399 $421,627 3.67 11 12 13 $12,446 44.8% 14 $27,799 $1,512,206 $3,084,370 49.0% 15 16 17 $2,693 9.7% 18 $27,799 $208,042 $3,084,370 6.7% 19 20 21 $15,353 4.1 22 $3,716 $1,572,164 $502,860 3.1 23 24 25 365 88 365 117 26 4.1 days 3.1 days 27 28 29 $27,799 8.5 $3,084,370 12.6 Title Page Profiles Ratios Summary Bibliography Formula B. K M 0 A You all get the chance to play the role of financial analyst below. The summary should be a comparison of each company's performance for each major category of ratios listed below. Focus on major differences as you compare each company's performance. A nice way to 1 conclude is to state which company you feel is the better investment and why. 2 Liquidity: NIKE has the advantage for the current ratio. NIKE has $3.05 in current assets for every dollar in current liabilities while Under Armour has only 98 cents in current assets for every dollar in current liabilities. NIKE has the advantage for the inventory turnover ratio, but Under Armour has the advantage for the accounts receivable turnover ratio. NIKE turns over its inventory 4.1 times to Under Armour's 3.1 times. Under Armour has the advantage for the accounts receivable turnover ratio as Under Armour collects on its 3 receivables 12.6 times to Nike's 8.5 times. 4 5 6 Solvency: Under Armour has less debt than NIKE as evidenced by Under Armour's 35.5% debt-to-assets ratio as compared to NIKE's 41.8% debt-to-assets ratio. NIKE can cover its interest expense 108.4 times with income before interest and taxes, while Under Armour can only cover its interest expense 65.1 times with their income before interest and taxes. NIKE has free cash flow of $1.3 billion while Under Armour has $78.5 million in free cash flow. Profitability: Under Armour has the advantage for the gross profit rate at 49% while NIKE has a 44.8% gross profit rate percentage. NIKE has the advantage for the profit margin ratio at 9.7% versus 6.7% for Under Armour. Under Armour has the advantage for asset turnover as they turn their assets 1.68 times to Nike's 1.54 times. NIKE has the advantage for both return on assets (ROA) and return on common stockholder's equity (ROE). NIKE has an ROA of 14.9% to Under Armour's 11.3%. NIKE also has the advantage for return on 7 common stockholders' equity with an ROE of 24.6% to Under Armour's 17.3%. 8 Conclusion: Under Armour has less debt than NIKE as measured by the debt to assets ratio, but NIKE has a stronger current ratio and times-interest earned ratio. Regarding profitability, NIKE has the advantage for return on assets (ROA) and return on common stockholders' equity (ROE). For both a conservative investor 9 and growth investor, NIKE looks like the better choice. B 10 11 D E F G H J K L M Complete one paragraph, profiling each company's business, including information such as brief histories, where each company is located, number of employees, the products each company sells, and so forth. Please reference any websites that you used for the profiles on the Bibliography tab. NIKE, Inc. designs, develops, markets, and sells athletic apparel, footwear, equipment, and accessories. NIKE's headquarters are in Beaverton, Oregon. They were founded in 1964 as Blue Ribbon Sports, Inc. but, in 1971, they changed their name to NIKE, Inc. According to Yahoo! Finance, NIKE has 76,700 full-time employees. NIKE is known for their celebrity endorsements including basketball icon, Michael Jordan. NIKE had 2014 net product sales of $27.8 billion. Under Armour, Inc. develops, markets, and distributes performance apparel, footwear, and accessories. Under Armour was founded in 1996 and is headquartered in Baltimore, Maryland. According to Yahoo! Finance, Under Armour has 7,000 full-time employees. Under Armour was founded by Kevin Plank, a former University of Maryland college football player. Under Armour had net product sales of $3.1 billion for 2014. F48 40 Return on Assets (ROA) 41 42 43 44 Debt to assets ratio 45 46 47 48 Times-Interest Earned Ratio 49 50 51 Jx =208042+5335+134168 A B Net income Average total assets Total Liabilities Total Assets Net income + interest expense + income tax expense interest expense C D $2,693 $18,070 E 14.9% $208,042 $1,836,412 $7,770 $18,594 41.8% $744,783 $2,095,083 $3,577 $33 108.4 347,545 5,335 52 Dividend Yield 53 (Please follow the Course Project instructions to calculate the current dividend yield.) Dividend per share of common stock (Yahoo Finance 12/24/2015) Market price per share of common stock (Yahoo Finance 12/24/2015) $1.28 2.0% $0.00 $63.18 $81.20 54 55 Return on Common Stockholders' Equity (ROE) 56 57 58 Net income - preferred dividends Average common stockholders' equity 2,693 10,952.50 24.6% 208,042 1,201,827.00 59 Free cash flow 60 61 62 63 Price-Earnings Ratio 64 (Please see the Course Project instructions for the dates to use for this ratio.) 65 66 67 68 69 70 71 72 Title Page Profiles Ratios Summary Bibliography Deady $1,324 Net cash provided by operating activities minus capital expenditures minus cash dividends in millions Market price per share of common stock as of 5/30/2014 for Nike and 12/31/2014 for Under Armour Earnings per share $76.91 $3.05 25 $67.90 $0.98 | A 1 Use this Excel spreadsheet to compute ratios; show your computations for all ratios on this tab, and also include your commentary. 2 The 2014 financial statements used to calculate these ratios are available in the Investor Relations sections of the Nikeand Under Armour websites. 3 4 56986 7 6 Earnings per Share of Common Stock (basic - common) 9 Current Ratio 10 11 12 13 Gross Profit Rate 14 15 16 17 Profit Margin 18 19 20 21 Inventory Turnover 22 23 24 25 Days in Inventory 26 27 28 29 Accounts Receivable Turnover Title Page D E G NIKE Under Armo 5/31/2014 12/31/2014 As given in the income statement $ 3.05 Current assets Current liabilities $13,696 $5,027 2.72 $1,549,399 $421,627 Gross profit $12,446 44.8% Net sales $27,799 $1,512,206 $3,084,370 Net income Net sales $2,693 9.7% $208,042 $27,799 $3,084,370 Cost of goods sold $15,353 4.1 Average inventory $3,716 $1,572,164 $502,860 365 days Inventory turnover 365 4.1 88 days 365 3.1 Net credit sales $27,799 8.5 $3,084,370 Profiles Ratios Summary Bibliography (+) 7 8 9 Current Ratio 10 11 12 13 Gross Profit Rate 14 15 16 17 Profit Margin 18 19 20 21 Inventory Turnover 22 23 24 25 Days in Inventory 26 27 28 29 Accounts Receivable Turnover 30 31 32 Average Collection Period 33 34 35 36 Asset turnover 37 38 39 Title Page Profiles Ratios Summary Bibliography B C D E Current assets $13,696 = 2.72 Current liabilities $5,027 $1,549,399 $421,627 Gross profit $12,446 44.8% Net sales $27,799 $1,512,206 $3,084,370 Net income Net sales $2,693 9.7% $27,799 $208,042 $3,084,370 Cost of goods sold Average inventory $15,353 $3,716 4.1 $1,572,164 $502,860 365 days Inventory turnover 365 4.1 88 days 365 3.1 Net credit sales $27,799 8.5 Average net accounts receivable $3,276 $3,084,370 $244,894 365 days 365 43 365 Accounts receivable turnover 8.5 days 12.6 Net sales Average total assets $27,799 1.54 $3,084,370 $18,070 $1,836,412 G 1 2 3 F48 D E 4 NIKE fx =208042+5335+134168 F G H Under Armour Interpretation and comparison between the two companies' ratios (reading Chapter 13 will help you prepare the commentary) The comparison of the ratios is an important part of the project. A good approach is to briefly explain what the ratio tells us. Indicate whether a higher or lower ratio is better. Then compare the two companies on this basis. Remember that each ratio below requires a comparison. 5 5/31/2014 12/31/2014 6 $ 3.05 $0.98 7 8 9 $13,696 = 2.72 10 $5,027 $1,549,399 $421,627 3.67 11 12 13 $12,446 44.8% 14 $27,799 $1,512,206 $3,084,370 49.0% 15 16 17 $2,693 9.7% 18 $27,799 $208,042 $3,084,370 6.7% 19 20 21 $15,353 4.1 22 $3,716 $1,572,164 $502,860 3.1 23 24 25 365 88 365 117 26 4.1 days 3.1 days 27 28 29 $27,799 8.5 $3,084,370 12.6 Title Page Profiles Ratios Summary Bibliography Formula B. K M 0 A You all get the chance to play the role of financial analyst below. The summary should be a comparison of each company's performance for each major category of ratios listed below. Focus on major differences as you compare each company's performance. A nice way to 1 conclude is to state which company you feel is the better investment and why. 2 Liquidity: NIKE has the advantage for the current ratio. NIKE has $3.05 in current assets for every dollar in current liabilities while Under Armour has only 98 cents in current assets for every dollar in current liabilities. NIKE has the advantage for the inventory turnover ratio, but Under Armour has the advantage for the accounts receivable turnover ratio. NIKE turns over its inventory 4.1 times to Under Armour's 3.1 times. Under Armour has the advantage for the accounts receivable turnover ratio as Under Armour collects on its 3 receivables 12.6 times to Nike's 8.5 times. 4 5 6 Solvency: Under Armour has less debt than NIKE as evidenced by Under Armour's 35.5% debt-to-assets ratio as compared to NIKE's 41.8% debt-to-assets ratio. NIKE can cover its interest expense 108.4 times with income before interest and taxes, while Under Armour can only cover its interest expense 65.1 times with their income before interest and taxes. NIKE has free cash flow of $1.3 billion while Under Armour has $78.5 million in free cash flow. Profitability: Under Armour has the advantage for the gross profit rate at 49% while NIKE has a 44.8% gross profit rate percentage. NIKE has the advantage for the profit margin ratio at 9.7% versus 6.7% for Under Armour. Under Armour has the advantage for asset turnover as they turn their assets 1.68 times to Nike's 1.54 times. NIKE has the advantage for both return on assets (ROA) and return on common stockholder's equity (ROE). NIKE has an ROA of 14.9% to Under Armour's 11.3%. NIKE also has the advantage for return on 7 common stockholders' equity with an ROE of 24.6% to Under Armour's 17.3%. 8 Conclusion: Under Armour has less debt than NIKE as measured by the debt to assets ratio, but NIKE has a stronger current ratio and times-interest earned ratio. Regarding profitability, NIKE has the advantage for return on assets (ROA) and return on common stockholders' equity (ROE). For both a conservative investor 9 and growth investor, NIKE looks like the better choice. B 10 11 D E F G H J K L M
Expert Answer:

Related Book For 
Posted Date:
Students also viewed these finance questions
-
Read the case study and answer the question below with a one page response. What does a SWOT analysis reveal about the overall attractiveness of Under Armours situation? Founded in 1996 by former...
-
Answer the following questions: Discuss Friedman's position on CSR considering contemporary thinking on the subject. Do you agree or disagree with Friedman? What do you think Van Hameren should do...
-
When is inflation an important issue in conducting case analysis? Why bother?
-
A variation of the importance sampling algorithm of Exercise 5.64 can actually produce an approximate sample from f. Again let X ~ f and generate Y1, Y2,..., Ym, iid from g. Calculate qi =...
-
Let y be a boundary point of a nonempty, convex set S in a Euclidean space X. There exists a supporting hyperplane at y; that is, there exists a continuous linear functional f X* such that f (y) f...
-
Is energy lost when glucose is converted into ATP during cellular respiration?
-
1. Based on Vicente Ruizs actions and his conversation with Chuck Moore, what differences do you detect in cultural attitudes toward communications in Mexico as compared with the United States? Is...
-
If a Hershey's Chocolate allows its lower level managers to aid in the decision making process because these managers are more aware of what is going on and need to develop their decision making...
-
Discuss how post-pandemic shifts affect decision-making in forecasting demand and supply , planning for operations and logistics, inventory and pricing Include tools and techniques used to address...
-
How can a manager improve the culture of his/her workplace in a short period of time? Is this possible?
-
Ruth Thomas owns a home that has been pledged to First Bank and Trust to secure a mortgage debt of $180,000Ruth Thomas sells her home to John Kendall, who purchases the home and assumes the mortgage...
-
Are urgent care clinics and free-standing emergency departments--also growing in prevalence--the solution to an access problem?
-
What are the molecular mechanisms underlying mitochondrial fission and fusion dynamics, and how do alterations in these processes impact organelle morphology, distribution, and function?
-
Which of the demand determinants is relevant to your decision-making when purchasing something?
-
What are the key principles of self-efficacy theory, reinforcement theory, equity theory, and expectancy theory?
-
Kims Konstructions has assembled the following data for a proposed straw-reinforced brick maker (SRBM): SRBM Cost: $26,000 Life: 5 years Revenue (p.a.) $11,000 Operating Expenses (p.a.) $3,000...
-
Consider the common problems with project cost estimation and recall a project with which you have been involved. Which of these common problems did you encounter most often? Why?
-
This chapter suggests that estimating project costs is a challenging process that can resemble an art form as much as science. Describe the different methods used to estimate costs on a project. How...
-
Explain the concept of activity-based costing. What are the steps involved in this process?

Study smarter with the SolutionInn App