

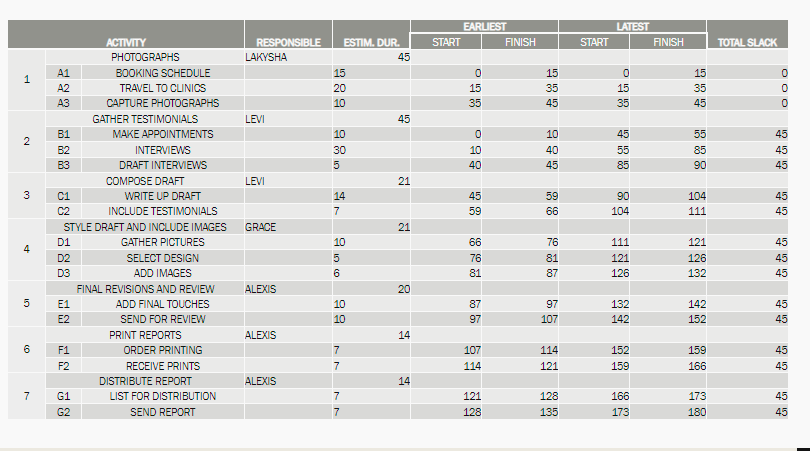
Question: Complete Question 3 given the information from the chart. Please give a brief explanation of how you got to your answer. EARLIEST START FINISH LATEST
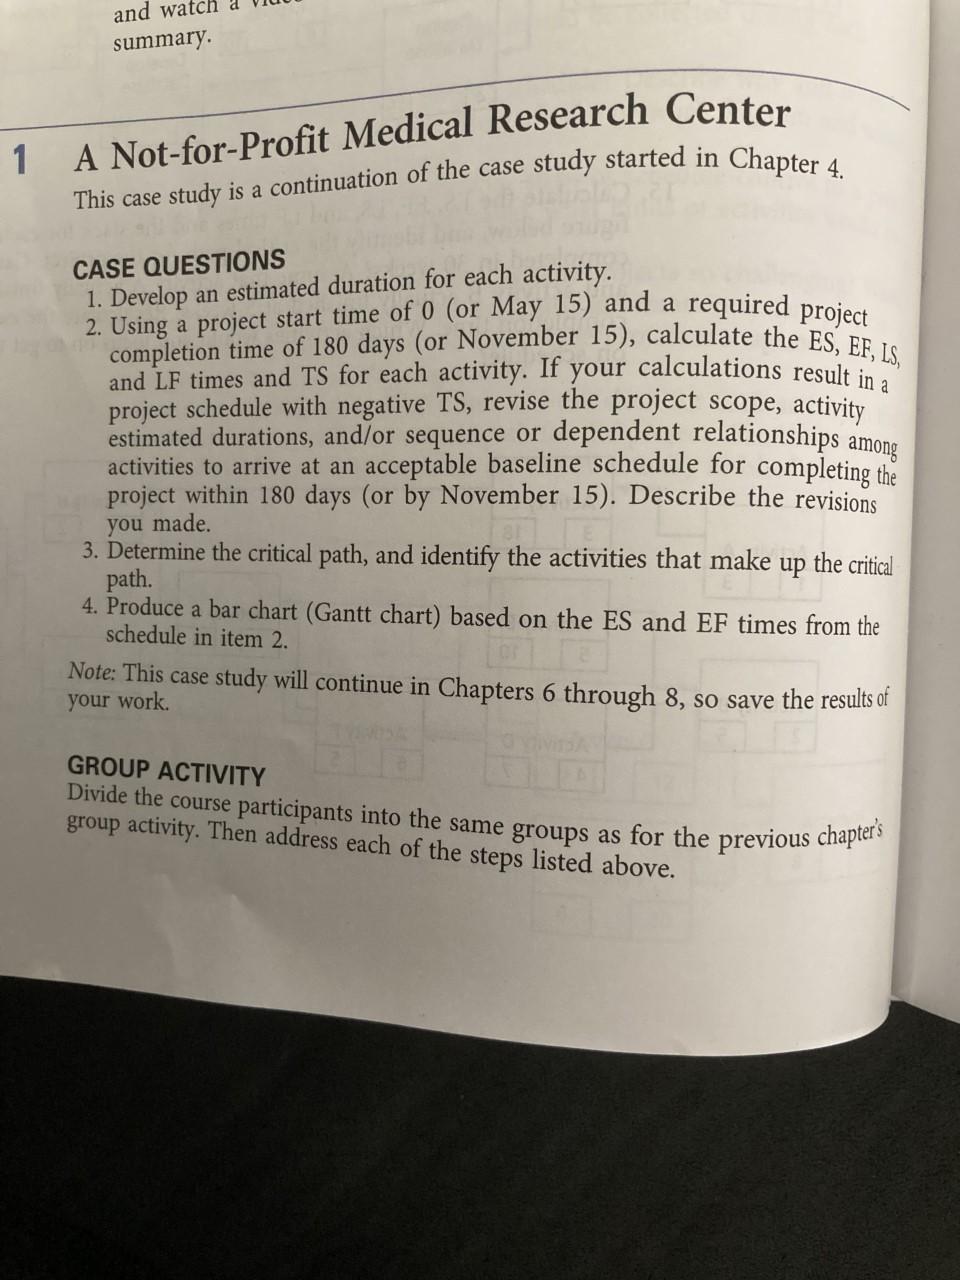
Complete Question 3 given the information from the chart. Please give a brief explanation of how you got to your answer.
Step by Step Solution
There are 3 Steps involved in it
1 Expert Approved Answer
Step: 1 Unlock

Question Has Been Solved by an Expert!
Get step-by-step solutions from verified subject matter experts
Step: 2 Unlock
Step: 3 Unlock