

Question: Complete Table 3 below based on climate normal data (1981-20110) obtained from the Government of Canada website. Using the monthly temperature and precipitation data provided
- Complete Table 3 below based on climate normal data (1981-20110) obtained from the Government of Canada website. Using the monthly temperature and precipitation data provided in Table 3 below and from the government of Canada website, prepare climographs for Tofino, BC; Yellowknife, NT; and Kingston, ON, contrasting the temperature and precipitation data for these three locations. Use the climograph template provided for the assignment. This format is similar to those in your textbook (e.g., p. 227 (Toronto, ON) and 229 (Resolute, NU). Be sure to include appropriate captions including station details. You also need to calculate and provide the total annual precipitation, the mean annual temperature, and the annual range in temperature (based on mean monthly temperatures). Submit the graphs with
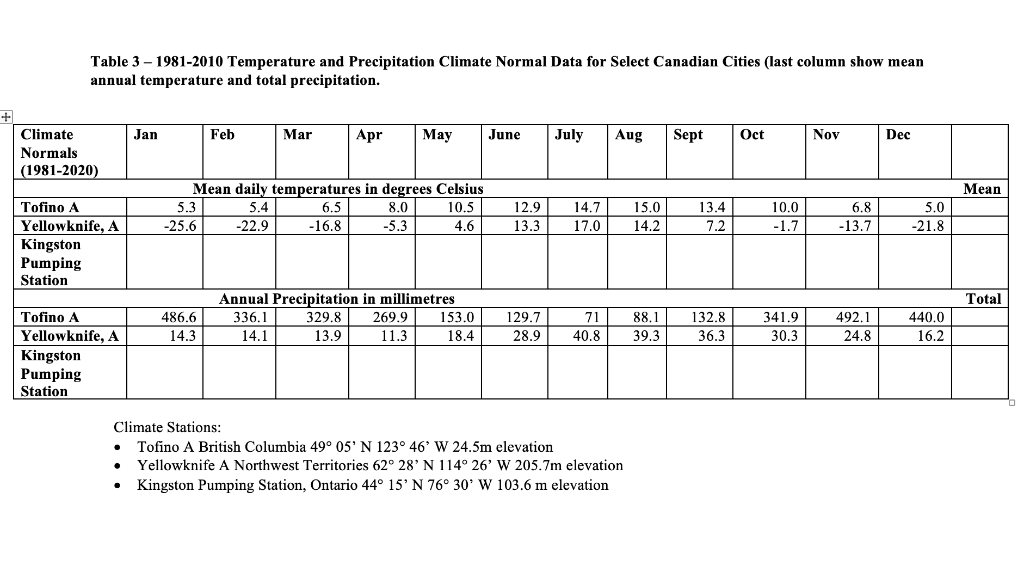 the rest of your assignment. (15 marks)
Table 3 - 1981-2010 Temperature and Precipitation Climate Normal Data for Select Canadian Cities (last column show mean annual temperature and total precipitation. Jan Feb Mar Apr May June July Aug Sept Oct Nov Dec + Climate Normals (1981-2020) Mean Mean daily temperatures in degrees Celsius 5.3 5.4 6.5 8.0 10.5 -25.6 -22.9 -16.8 -5.3 4.6 12.9 13.3 14.7 17.0 15.0 14.2 13.4 7.2 10.0 -1.7 6.8 -13.7 5.0 -21.8 Tofino A Yellowknife, A Kingston Pumping Station Total 486.6 14.3 Annual Precipitation in millimetres 336.1 329.8 269.9 153.0 14.1 13.9 11.3 18.4 129.7 28.9 71 40.8 88.1 39.3 132.8 36.3 341.9 30.3 492.1 24.8 440,0 16.2 Tofino A Yellowknife, A Kingston Pumping Station Climate Stations: Tofino A British Columbia 4905' N 123 46' W 24.5m elevation Yellowknife A Northwest Territories 62 28' N 114 26' W 205.7m elevation Kingston Pumping Station, Ontario 44 15' N 76 30' W 103.6 m elevation . Table 3 - 1981-2010 Temperature and Precipitation Climate Normal Data for Select Canadian Cities (last column show mean annual temperature and total precipitation. Jan Feb Mar Apr May June July Aug Sept Oct Nov Dec + Climate Normals (1981-2020) Mean Mean daily temperatures in degrees Celsius 5.3 5.4 6.5 8.0 10.5 -25.6 -22.9 -16.8 -5.3 4.6 12.9 13.3 14.7 17.0 15.0 14.2 13.4 7.2 10.0 -1.7 6.8 -13.7 5.0 -21.8 Tofino A Yellowknife, A Kingston Pumping Station Total 486.6 14.3 Annual Precipitation in millimetres 336.1 329.8 269.9 153.0 14.1 13.9 11.3 18.4 129.7 28.9 71 40.8 88.1 39.3 132.8 36.3 341.9 30.3 492.1 24.8 440,0 16.2 Tofino A Yellowknife, A Kingston Pumping Station Climate Stations: Tofino A British Columbia 4905' N 123 46' W 24.5m elevation Yellowknife A Northwest Territories 62 28' N 114 26' W 205.7m elevation Kingston Pumping Station, Ontario 44 15' N 76 30' W 103.6 m elevation
Step by Step Solution
There are 3 Steps involved in it

Get step-by-step solutions from verified subject matter experts