

Question: Complete Table 3,1. Plot the individual and market demand and supply curves using the graph paper provioca (Case #1). Then answer the following questions. Table
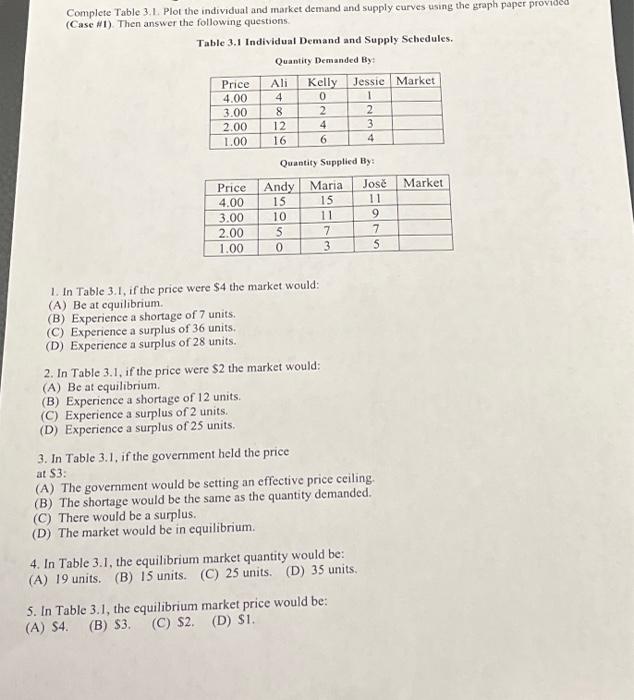
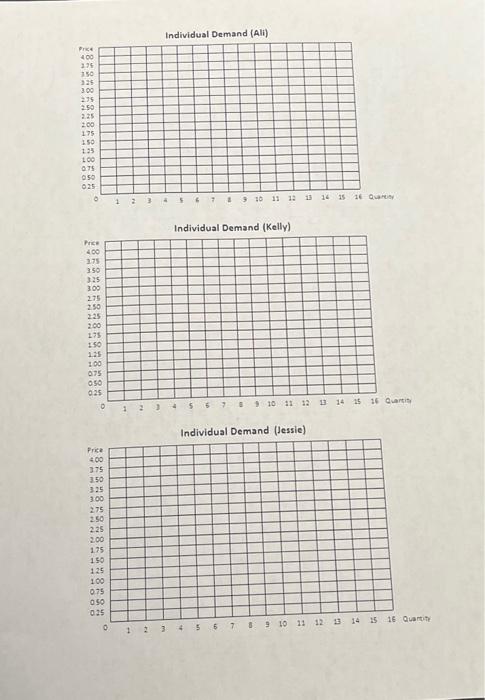
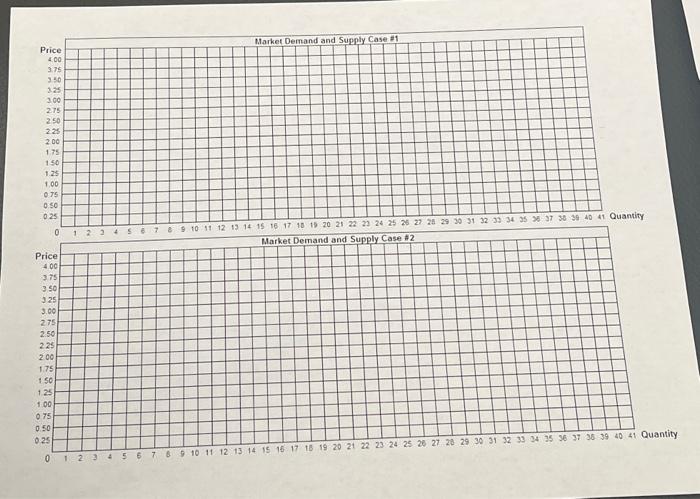
Complete Table 3,1. Plot the individual and market demand and supply curves using the graph paper provioca (Case \#1). Then answer the following questions. Table 3.1 Individual Demand and Supply Schedules. Quantity Demanded By: Quantity Supplied By: 1. In Table 3.1 , if the price were $4 the market would: (A) Be at equilibrium. (B) Experience a shortage of 7 units. (C) Experience a surplus of 36 units. (D) Experience a surplus of 28 units. 2. In Table 3.1 , if the price were $2 the market would: (A) Be at equilibrium. (B) Experience a shortage of 12 units. (C) Experience a surplus of 2 units. (D) Experience a surplus of 25 units. 3. In Table 3.1, if the government held the price at 53 : (A) The govemment would be setting an effective price ceiling. (B) The shortage would be the same as the quantity demanded. (C) There would be a surplus. (D) The market would be in equilibrium. 4. In Table 3.1, the equilibrium market quantity would be: (A) 19 units. (B) 15 units. (C) 25 units. (D) 35 units. 5. In Table 3.1, the equilibrium market price would be: (A) $4. (B) 53 . (C) S2. (D) S1. Imdiscideal namand (Kellv) Individual Demand (Jessie)
Step by Step Solution
There are 3 Steps involved in it

Get step-by-step solutions from verified subject matter experts