

In the labor market, employers demand hours of work and workers supply hours of work. You...
Fantastic news! We've Found the answer you've been seeking!
Question:


Transcribed Image Text:
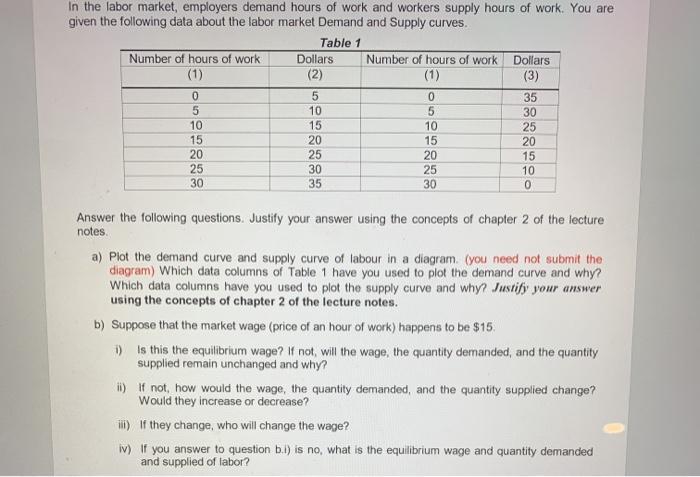
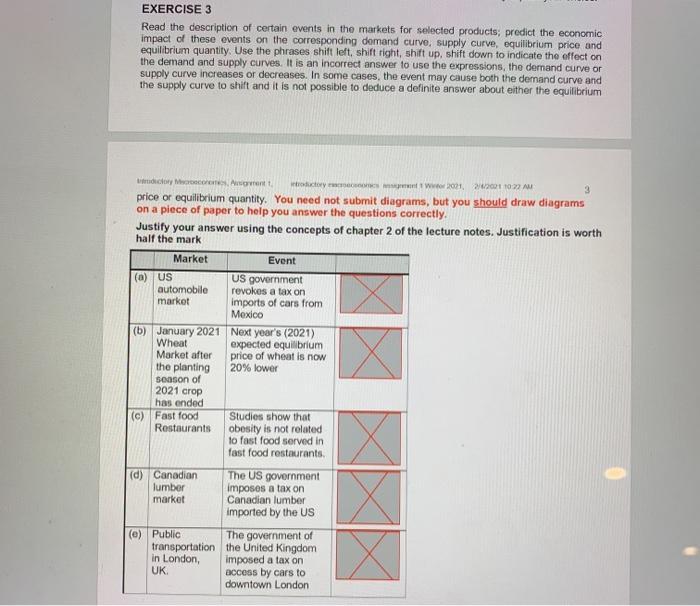
In the labor market, employers demand hours of work and workers supply hours of work. You are given the following data about the labor market Demand and Supply curves. Table 1 Number of hours of work (1) Number of hours of work Dollars (1) Dollars (2) (3) 35 10 30 25 10 15 20 10 15 15 20 20 25 30 25 20 15 30 35 25 10 30 Answer the following questions. Justify your answer using the concepts of chapter 2 of the lecture notes. a) Plot the demand curve and supply curve of labour in a diagram. (you need not submit the diagram) Which data columns of Table 1 have you used to plot the demand curve and why Which data columns have you used to plot the supply curve and why? Justify your answer using the concepts of chapter 2 of the lecture notes. b) Suppose that the market wage (price of an hour of work) happens to be $15. i) Is this the equilibrium wage? If not, will the wage, the quantity demanded, and the quantity supplied remain unchanged and why? i) If not, how would the wage, the quantity demanded, and the quantity supplied change? Would they increase or decrease? iii) If they change, who will change the wage? iv) If you answer to question b.i) is no, what is the equilibrium wage and quantity demanded and supplied of labor? c) Recall that the surface of a triangle = (Base * Height) /2). Calculate i) the maximum total net social benefit at the equilibrium. i) Calculate the maximum total profit or total benefit of the employers at the equilibrium i) Calculate the producer's surplus (= workers' surplus) at the equilibrium wage at the equilibrium. iv) How much is the difference between the marginal social benefit and the marginal social cost at the equilibrium? d) How does the market divide the maximum total net social benefit between employers and workers? Is there any net social benefit left unclaimed? e) Suppose that the government imposes a minimum wage of $25 per hour but the government cannot force employers to employ more than the number of workers consistent with their demand curve. i) Is this minimum wage consistent with an efficient allocation of resources? How much is the difference if any between the marginal social benefit and the marginal social cost at the minimum wage? Which one is greater? 1) Calculate the maximum total net social benefit corresponding to the minimum wage g) Compare the total net social benefit before and after the imposition of the nominal wage. Who loses and who gains from the imposition of the minimum wage? Exercise 2 Suppose that the central bank of the US increases the interest rate in the US from 1% to 3% while the European central bank maintains its interest rate at 0.5%. Answer the following questions. Justify your answer using diagrams and the concepts developed in chapter 14 of the lecture notes. No numbers are required. a) What happens to net capital inflows to the US and net capital outflows out of the US? b) What should happen to the exchange rate of the US dollar in terms of the Euro, the European money? Use the demand and supply model to answer this question. c) What happens to US exports, imports and trade balance? d) Is it better to have a fixed exchange rate or a flexible exchange rate? Briefly explain your choice. EXERCISE 3 Read the description of certain events in the markets for selected products; predict the economic impact of these events on the corresponding demand curve, supply curve, equilibrium price and equilibrium quantity. Use the phrases shift left, shift right, shift up, shift down to indicate the effect on the demand and supply curves. It is an incorrect answer to use the expressions, the demand curve or supply curve increases or decreases. In some cases, the event may cause both the demand curve and the supply curve to shift and it is not possible to deduce a definite answer about either the equilibrium idclory Msoroecorem, Agment t ntroductory e cnomcs nt Wter 2021, 2/2021 10 22 AM 3. price or equilibrium quantity. You need not submit diagrams, but you should draw diagrams on a piece of paper to help you answer the questions correctly. Justify your answer using the concepts of chapter 2 of the lectr half the mark notes. Justification is worth Market Event (a) US automobile market US government revokes a tax on imports of cars from Mexico (b) January 2021 Next year's (2021) Wheat Market after the planting expected equilibrium price of wheat is now 20% lower season of 2021 crop has ended (c) Fast food Restaurants Studies show that obesity is not related to fast food served in fast food restaurants. (d) Canadian lumber market The US government imposes a tax on Canadian lumber imported by the US (e) Public The government of transportation the United Kingdom imposed a tax on access by cars to downtown London in London, UK. In the labor market, employers demand hours of work and workers supply hours of work. You are given the following data about the labor market Demand and Supply curves. Table 1 Number of hours of work (1) Number of hours of work Dollars (1) Dollars (2) (3) 35 10 30 25 10 15 20 10 15 15 20 20 25 30 25 20 15 30 35 25 10 30 Answer the following questions. Justify your answer using the concepts of chapter 2 of the lecture notes. a) Plot the demand curve and supply curve of labour in a diagram. (you need not submit the diagram) Which data columns of Table 1 have you used to plot the demand curve and why Which data columns have you used to plot the supply curve and why? Justify your answer using the concepts of chapter 2 of the lecture notes. b) Suppose that the market wage (price of an hour of work) happens to be $15. i) Is this the equilibrium wage? If not, will the wage, the quantity demanded, and the quantity supplied remain unchanged and why? i) If not, how would the wage, the quantity demanded, and the quantity supplied change? Would they increase or decrease? iii) If they change, who will change the wage? iv) If you answer to question b.i) is no, what is the equilibrium wage and quantity demanded and supplied of labor? c) Recall that the surface of a triangle = (Base * Height) /2). Calculate i) the maximum total net social benefit at the equilibrium. i) Calculate the maximum total profit or total benefit of the employers at the equilibrium i) Calculate the producer's surplus (= workers' surplus) at the equilibrium wage at the equilibrium. iv) How much is the difference between the marginal social benefit and the marginal social cost at the equilibrium? d) How does the market divide the maximum total net social benefit between employers and workers? Is there any net social benefit left unclaimed? e) Suppose that the government imposes a minimum wage of $25 per hour but the government cannot force employers to employ more than the number of workers consistent with their demand curve. i) Is this minimum wage consistent with an efficient allocation of resources? How much is the difference if any between the marginal social benefit and the marginal social cost at the minimum wage? Which one is greater? 1) Calculate the maximum total net social benefit corresponding to the minimum wage g) Compare the total net social benefit before and after the imposition of the nominal wage. Who loses and who gains from the imposition of the minimum wage? Exercise 2 Suppose that the central bank of the US increases the interest rate in the US from 1% to 3% while the European central bank maintains its interest rate at 0.5%. Answer the following questions. Justify your answer using diagrams and the concepts developed in chapter 14 of the lecture notes. No numbers are required. a) What happens to net capital inflows to the US and net capital outflows out of the US? b) What should happen to the exchange rate of the US dollar in terms of the Euro, the European money? Use the demand and supply model to answer this question. c) What happens to US exports, imports and trade balance? d) Is it better to have a fixed exchange rate or a flexible exchange rate? Briefly explain your choice. EXERCISE 3 Read the description of certain events in the markets for selected products; predict the economic impact of these events on the corresponding demand curve, supply curve, equilibrium price and equilibrium quantity. Use the phrases shift left, shift right, shift up, shift down to indicate the effect on the demand and supply curves. It is an incorrect answer to use the expressions, the demand curve or supply curve increases or decreases. In some cases, the event may cause both the demand curve and the supply curve to shift and it is not possible to deduce a definite answer about either the equilibrium idclory Msoroecorem, Agment t ntroductory e cnomcs nt Wter 2021, 2/2021 10 22 AM 3. price or equilibrium quantity. You need not submit diagrams, but you should draw diagrams on a piece of paper to help you answer the questions correctly. Justify your answer using the concepts of chapter 2 of the lectr half the mark notes. Justification is worth Market Event (a) US automobile market US government revokes a tax on imports of cars from Mexico (b) January 2021 Next year's (2021) Wheat Market after the planting expected equilibrium price of wheat is now 20% lower season of 2021 crop has ended (c) Fast food Restaurants Studies show that obesity is not related to fast food served in fast food restaurants. (d) Canadian lumber market The US government imposes a tax on Canadian lumber imported by the US (e) Public The government of transportation the United Kingdom imposed a tax on access by cars to downtown London in London, UK. In the labor market, employers demand hours of work and workers supply hours of work. You are given the following data about the labor market Demand and Supply curves. Table 1 Number of hours of work (1) Number of hours of work Dollars (1) Dollars (2) (3) 35 10 30 25 10 15 20 10 15 15 20 20 25 30 25 20 15 30 35 25 10 30 Answer the following questions. Justify your answer using the concepts of chapter 2 of the lecture notes. a) Plot the demand curve and supply curve of labour in a diagram. (you need not submit the diagram) Which data columns of Table 1 have you used to plot the demand curve and why Which data columns have you used to plot the supply curve and why? Justify your answer using the concepts of chapter 2 of the lecture notes. b) Suppose that the market wage (price of an hour of work) happens to be $15. i) Is this the equilibrium wage? If not, will the wage, the quantity demanded, and the quantity supplied remain unchanged and why? i) If not, how would the wage, the quantity demanded, and the quantity supplied change? Would they increase or decrease? iii) If they change, who will change the wage? iv) If you answer to question b.i) is no, what is the equilibrium wage and quantity demanded and supplied of labor? c) Recall that the surface of a triangle = (Base * Height) /2). Calculate i) the maximum total net social benefit at the equilibrium. i) Calculate the maximum total profit or total benefit of the employers at the equilibrium i) Calculate the producer's surplus (= workers' surplus) at the equilibrium wage at the equilibrium. iv) How much is the difference between the marginal social benefit and the marginal social cost at the equilibrium? d) How does the market divide the maximum total net social benefit between employers and workers? Is there any net social benefit left unclaimed? e) Suppose that the government imposes a minimum wage of $25 per hour but the government cannot force employers to employ more than the number of workers consistent with their demand curve. i) Is this minimum wage consistent with an efficient allocation of resources? How much is the difference if any between the marginal social benefit and the marginal social cost at the minimum wage? Which one is greater? 1) Calculate the maximum total net social benefit corresponding to the minimum wage g) Compare the total net social benefit before and after the imposition of the nominal wage. Who loses and who gains from the imposition of the minimum wage? Exercise 2 Suppose that the central bank of the US increases the interest rate in the US from 1% to 3% while the European central bank maintains its interest rate at 0.5%. Answer the following questions. Justify your answer using diagrams and the concepts developed in chapter 14 of the lecture notes. No numbers are required. a) What happens to net capital inflows to the US and net capital outflows out of the US? b) What should happen to the exchange rate of the US dollar in terms of the Euro, the European money? Use the demand and supply model to answer this question. c) What happens to US exports, imports and trade balance? d) Is it better to have a fixed exchange rate or a flexible exchange rate? Briefly explain your choice. EXERCISE 3 Read the description of certain events in the markets for selected products; predict the economic impact of these events on the corresponding demand curve, supply curve, equilibrium price and equilibrium quantity. Use the phrases shift left, shift right, shift up, shift down to indicate the effect on the demand and supply curves. It is an incorrect answer to use the expressions, the demand curve or supply curve increases or decreases. In some cases, the event may cause both the demand curve and the supply curve to shift and it is not possible to deduce a definite answer about either the equilibrium idclory Msoroecorem, Agment t ntroductory e cnomcs nt Wter 2021, 2/2021 10 22 AM 3. price or equilibrium quantity. You need not submit diagrams, but you should draw diagrams on a piece of paper to help you answer the questions correctly. Justify your answer using the concepts of chapter 2 of the lectr half the mark notes. Justification is worth Market Event (a) US automobile market US government revokes a tax on imports of cars from Mexico (b) January 2021 Next year's (2021) Wheat Market after the planting expected equilibrium price of wheat is now 20% lower season of 2021 crop has ended (c) Fast food Restaurants Studies show that obesity is not related to fast food served in fast food restaurants. (d) Canadian lumber market The US government imposes a tax on Canadian lumber imported by the US (e) Public The government of transportation the United Kingdom imposed a tax on access by cars to downtown London in London, UK. In the labor market, employers demand hours of work and workers supply hours of work. You are given the following data about the labor market Demand and Supply curves. Table 1 Number of hours of work (1) Number of hours of work Dollars (1) Dollars (2) (3) 35 10 30 25 10 15 20 10 15 15 20 20 25 30 25 20 15 30 35 25 10 30 Answer the following questions. Justify your answer using the concepts of chapter 2 of the lecture notes. a) Plot the demand curve and supply curve of labour in a diagram. (you need not submit the diagram) Which data columns of Table 1 have you used to plot the demand curve and why Which data columns have you used to plot the supply curve and why? Justify your answer using the concepts of chapter 2 of the lecture notes. b) Suppose that the market wage (price of an hour of work) happens to be $15. i) Is this the equilibrium wage? If not, will the wage, the quantity demanded, and the quantity supplied remain unchanged and why? i) If not, how would the wage, the quantity demanded, and the quantity supplied change? Would they increase or decrease? iii) If they change, who will change the wage? iv) If you answer to question b.i) is no, what is the equilibrium wage and quantity demanded and supplied of labor? c) Recall that the surface of a triangle = (Base * Height) /2). Calculate i) the maximum total net social benefit at the equilibrium. i) Calculate the maximum total profit or total benefit of the employers at the equilibrium i) Calculate the producer's surplus (= workers' surplus) at the equilibrium wage at the equilibrium. iv) How much is the difference between the marginal social benefit and the marginal social cost at the equilibrium? d) How does the market divide the maximum total net social benefit between employers and workers? Is there any net social benefit left unclaimed? e) Suppose that the government imposes a minimum wage of $25 per hour but the government cannot force employers to employ more than the number of workers consistent with their demand curve. i) Is this minimum wage consistent with an efficient allocation of resources? How much is the difference if any between the marginal social benefit and the marginal social cost at the minimum wage? Which one is greater? 1) Calculate the maximum total net social benefit corresponding to the minimum wage g) Compare the total net social benefit before and after the imposition of the nominal wage. Who loses and who gains from the imposition of the minimum wage? Exercise 2 Suppose that the central bank of the US increases the interest rate in the US from 1% to 3% while the European central bank maintains its interest rate at 0.5%. Answer the following questions. Justify your answer using diagrams and the concepts developed in chapter 14 of the lecture notes. No numbers are required. a) What happens to net capital inflows to the US and net capital outflows out of the US? b) What should happen to the exchange rate of the US dollar in terms of the Euro, the European money? Use the demand and supply model to answer this question. c) What happens to US exports, imports and trade balance? d) Is it better to have a fixed exchange rate or a flexible exchange rate? Briefly explain your choice. EXERCISE 3 Read the description of certain events in the markets for selected products; predict the economic impact of these events on the corresponding demand curve, supply curve, equilibrium price and equilibrium quantity. Use the phrases shift left, shift right, shift up, shift down to indicate the effect on the demand and supply curves. It is an incorrect answer to use the expressions, the demand curve or supply curve increases or decreases. In some cases, the event may cause both the demand curve and the supply curve to shift and it is not possible to deduce a definite answer about either the equilibrium idclory Msoroecorem, Agment t ntroductory e cnomcs nt Wter 2021, 2/2021 10 22 AM 3. price or equilibrium quantity. You need not submit diagrams, but you should draw diagrams on a piece of paper to help you answer the questions correctly. Justify your answer using the concepts of chapter 2 of the lectr half the mark notes. Justification is worth Market Event (a) US automobile market US government revokes a tax on imports of cars from Mexico (b) January 2021 Next year's (2021) Wheat Market after the planting expected equilibrium price of wheat is now 20% lower season of 2021 crop has ended (c) Fast food Restaurants Studies show that obesity is not related to fast food served in fast food restaurants. (d) Canadian lumber market The US government imposes a tax on Canadian lumber imported by the US (e) Public The government of transportation the United Kingdom imposed a tax on access by cars to downtown London in London, UK. In the labor market, employers demand hours of work and workers supply hours of work. You are given the following data about the labor market Demand and Supply curves. Table 1 Number of hours of work (1) Number of hours of work Dollars (1) Dollars (2) (3) 35 10 30 25 10 15 20 10 15 15 20 20 25 30 25 20 15 30 35 25 10 30 Answer the following questions. Justify your answer using the concepts of chapter 2 of the lecture notes. a) Plot the demand curve and supply curve of labour in a diagram. (you need not submit the diagram) Which data columns of Table 1 have you used to plot the demand curve and why Which data columns have you used to plot the supply curve and why? Justify your answer using the concepts of chapter 2 of the lecture notes. b) Suppose that the market wage (price of an hour of work) happens to be $15. i) Is this the equilibrium wage? If not, will the wage, the quantity demanded, and the quantity supplied remain unchanged and why? i) If not, how would the wage, the quantity demanded, and the quantity supplied change? Would they increase or decrease? iii) If they change, who will change the wage? iv) If you answer to question b.i) is no, what is the equilibrium wage and quantity demanded and supplied of labor? c) Recall that the surface of a triangle = (Base * Height) /2). Calculate i) the maximum total net social benefit at the equilibrium. i) Calculate the maximum total profit or total benefit of the employers at the equilibrium i) Calculate the producer's surplus (= workers' surplus) at the equilibrium wage at the equilibrium. iv) How much is the difference between the marginal social benefit and the marginal social cost at the equilibrium? d) How does the market divide the maximum total net social benefit between employers and workers? Is there any net social benefit left unclaimed? e) Suppose that the government imposes a minimum wage of $25 per hour but the government cannot force employers to employ more than the number of workers consistent with their demand curve. i) Is this minimum wage consistent with an efficient allocation of resources? How much is the difference if any between the marginal social benefit and the marginal social cost at the minimum wage? Which one is greater? 1) Calculate the maximum total net social benefit corresponding to the minimum wage g) Compare the total net social benefit before and after the imposition of the nominal wage. Who loses and who gains from the imposition of the minimum wage? Exercise 2 Suppose that the central bank of the US increases the interest rate in the US from 1% to 3% while the European central bank maintains its interest rate at 0.5%. Answer the following questions. Justify your answer using diagrams and the concepts developed in chapter 14 of the lecture notes. No numbers are required. a) What happens to net capital inflows to the US and net capital outflows out of the US? b) What should happen to the exchange rate of the US dollar in terms of the Euro, the European money? Use the demand and supply model to answer this question. c) What happens to US exports, imports and trade balance? d) Is it better to have a fixed exchange rate or a flexible exchange rate? Briefly explain your choice. EXERCISE 3 Read the description of certain events in the markets for selected products; predict the economic impact of these events on the corresponding demand curve, supply curve, equilibrium price and equilibrium quantity. Use the phrases shift left, shift right, shift up, shift down to indicate the effect on the demand and supply curves. It is an incorrect answer to use the expressions, the demand curve or supply curve increases or decreases. In some cases, the event may cause both the demand curve and the supply curve to shift and it is not possible to deduce a definite answer about either the equilibrium idclory Msoroecorem, Agment t ntroductory e cnomcs nt Wter 2021, 2/2021 10 22 AM 3. price or equilibrium quantity. You need not submit diagrams, but you should draw diagrams on a piece of paper to help you answer the questions correctly. Justify your answer using the concepts of chapter 2 of the lectr half the mark notes. Justification is worth Market Event (a) US automobile market US government revokes a tax on imports of cars from Mexico (b) January 2021 Next year's (2021) Wheat Market after the planting expected equilibrium price of wheat is now 20% lower season of 2021 crop has ended (c) Fast food Restaurants Studies show that obesity is not related to fast food served in fast food restaurants. (d) Canadian lumber market The US government imposes a tax on Canadian lumber imported by the US (e) Public The government of transportation the United Kingdom imposed a tax on access by cars to downtown London in London, UK. In the labor market, employers demand hours of work and workers supply hours of work. You are given the following data about the labor market Demand and Supply curves. Table 1 Number of hours of work (1) Number of hours of work Dollars (1) Dollars (2) (3) 35 10 30 25 10 15 20 10 15 15 20 20 25 30 25 20 15 30 35 25 10 30 Answer the following questions. Justify your answer using the concepts of chapter 2 of the lecture notes. a) Plot the demand curve and supply curve of labour in a diagram. (you need not submit the diagram) Which data columns of Table 1 have you used to plot the demand curve and why Which data columns have you used to plot the supply curve and why? Justify your answer using the concepts of chapter 2 of the lecture notes. b) Suppose that the market wage (price of an hour of work) happens to be $15. i) Is this the equilibrium wage? If not, will the wage, the quantity demanded, and the quantity supplied remain unchanged and why? i) If not, how would the wage, the quantity demanded, and the quantity supplied change? Would they increase or decrease? iii) If they change, who will change the wage? iv) If you answer to question b.i) is no, what is the equilibrium wage and quantity demanded and supplied of labor? c) Recall that the surface of a triangle = (Base * Height) /2). Calculate i) the maximum total net social benefit at the equilibrium. i) Calculate the maximum total profit or total benefit of the employers at the equilibrium i) Calculate the producer's surplus (= workers' surplus) at the equilibrium wage at the equilibrium. iv) How much is the difference between the marginal social benefit and the marginal social cost at the equilibrium? d) How does the market divide the maximum total net social benefit between employers and workers? Is there any net social benefit left unclaimed? e) Suppose that the government imposes a minimum wage of $25 per hour but the government cannot force employers to employ more than the number of workers consistent with their demand curve. i) Is this minimum wage consistent with an efficient allocation of resources? How much is the difference if any between the marginal social benefit and the marginal social cost at the minimum wage? Which one is greater? 1) Calculate the maximum total net social benefit corresponding to the minimum wage g) Compare the total net social benefit before and after the imposition of the nominal wage. Who loses and who gains from the imposition of the minimum wage? Exercise 2 Suppose that the central bank of the US increases the interest rate in the US from 1% to 3% while the European central bank maintains its interest rate at 0.5%. Answer the following questions. Justify your answer using diagrams and the concepts developed in chapter 14 of the lecture notes. No numbers are required. a) What happens to net capital inflows to the US and net capital outflows out of the US? b) What should happen to the exchange rate of the US dollar in terms of the Euro, the European money? Use the demand and supply model to answer this question. c) What happens to US exports, imports and trade balance? d) Is it better to have a fixed exchange rate or a flexible exchange rate? Briefly explain your choice. EXERCISE 3 Read the description of certain events in the markets for selected products; predict the economic impact of these events on the corresponding demand curve, supply curve, equilibrium price and equilibrium quantity. Use the phrases shift left, shift right, shift up, shift down to indicate the effect on the demand and supply curves. It is an incorrect answer to use the expressions, the demand curve or supply curve increases or decreases. In some cases, the event may cause both the demand curve and the supply curve to shift and it is not possible to deduce a definite answer about either the equilibrium idclory Msoroecorem, Agment t ntroductory e cnomcs nt Wter 2021, 2/2021 10 22 AM 3. price or equilibrium quantity. You need not submit diagrams, but you should draw diagrams on a piece of paper to help you answer the questions correctly. Justify your answer using the concepts of chapter 2 of the lectr half the mark notes. Justification is worth Market Event (a) US automobile market US government revokes a tax on imports of cars from Mexico (b) January 2021 Next year's (2021) Wheat Market after the planting expected equilibrium price of wheat is now 20% lower season of 2021 crop has ended (c) Fast food Restaurants Studies show that obesity is not related to fast food served in fast food restaurants. (d) Canadian lumber market The US government imposes a tax on Canadian lumber imported by the US (e) Public The government of transportation the United Kingdom imposed a tax on access by cars to downtown London in London, UK. In the labor market, employers demand hours of work and workers supply hours of work. You are given the following data about the labor market Demand and Supply curves. Table 1 Number of hours of work (1) Number of hours of work Dollars (1) Dollars (2) (3) 35 10 30 25 10 15 20 10 15 15 20 20 25 30 25 20 15 30 35 25 10 30 Answer the following questions. Justify your answer using the concepts of chapter 2 of the lecture notes. a) Plot the demand curve and supply curve of labour in a diagram. (you need not submit the diagram) Which data columns of Table 1 have you used to plot the demand curve and why Which data columns have you used to plot the supply curve and why? Justify your answer using the concepts of chapter 2 of the lecture notes. b) Suppose that the market wage (price of an hour of work) happens to be $15. i) Is this the equilibrium wage? If not, will the wage, the quantity demanded, and the quantity supplied remain unchanged and why? i) If not, how would the wage, the quantity demanded, and the quantity supplied change? Would they increase or decrease? iii) If they change, who will change the wage? iv) If you answer to question b.i) is no, what is the equilibrium wage and quantity demanded and supplied of labor? c) Recall that the surface of a triangle = (Base * Height) /2). Calculate i) the maximum total net social benefit at the equilibrium. i) Calculate the maximum total profit or total benefit of the employers at the equilibrium i) Calculate the producer's surplus (= workers' surplus) at the equilibrium wage at the equilibrium. iv) How much is the difference between the marginal social benefit and the marginal social cost at the equilibrium? d) How does the market divide the maximum total net social benefit between employers and workers? Is there any net social benefit left unclaimed? e) Suppose that the government imposes a minimum wage of $25 per hour but the government cannot force employers to employ more than the number of workers consistent with their demand curve. i) Is this minimum wage consistent with an efficient allocation of resources? How much is the difference if any between the marginal social benefit and the marginal social cost at the minimum wage? Which one is greater? 1) Calculate the maximum total net social benefit corresponding to the minimum wage g) Compare the total net social benefit before and after the imposition of the nominal wage. Who loses and who gains from the imposition of the minimum wage? Exercise 2 Suppose that the central bank of the US increases the interest rate in the US from 1% to 3% while the European central bank maintains its interest rate at 0.5%. Answer the following questions. Justify your answer using diagrams and the concepts developed in chapter 14 of the lecture notes. No numbers are required. a) What happens to net capital inflows to the US and net capital outflows out of the US? b) What should happen to the exchange rate of the US dollar in terms of the Euro, the European money? Use the demand and supply model to answer this question. c) What happens to US exports, imports and trade balance? d) Is it better to have a fixed exchange rate or a flexible exchange rate? Briefly explain your choice. EXERCISE 3 Read the description of certain events in the markets for selected products; predict the economic impact of these events on the corresponding demand curve, supply curve, equilibrium price and equilibrium quantity. Use the phrases shift left, shift right, shift up, shift down to indicate the effect on the demand and supply curves. It is an incorrect answer to use the expressions, the demand curve or supply curve increases or decreases. In some cases, the event may cause both the demand curve and the supply curve to shift and it is not possible to deduce a definite answer about either the equilibrium idclory Msoroecorem, Agment t ntroductory e cnomcs nt Wter 2021, 2/2021 10 22 AM 3. price or equilibrium quantity. You need not submit diagrams, but you should draw diagrams on a piece of paper to help you answer the questions correctly. Justify your answer using the concepts of chapter 2 of the lectr half the mark notes. Justification is worth Market Event (a) US automobile market US government revokes a tax on imports of cars from Mexico (b) January 2021 Next year's (2021) Wheat Market after the planting expected equilibrium price of wheat is now 20% lower season of 2021 crop has ended (c) Fast food Restaurants Studies show that obesity is not related to fast food served in fast food restaurants. (d) Canadian lumber market The US government imposes a tax on Canadian lumber imported by the US (e) Public The government of transportation the United Kingdom imposed a tax on access by cars to downtown London in London, UK. In the labor market, employers demand hours of work and workers supply hours of work. You are given the following data about the labor market Demand and Supply curves. Table 1 Number of hours of work (1) Number of hours of work Dollars (1) Dollars (2) (3) 35 10 30 25 10 15 20 10 15 15 20 20 25 30 25 20 15 30 35 25 10 30 Answer the following questions. Justify your answer using the concepts of chapter 2 of the lecture notes. a) Plot the demand curve and supply curve of labour in a diagram. (you need not submit the diagram) Which data columns of Table 1 have you used to plot the demand curve and why Which data columns have you used to plot the supply curve and why? Justify your answer using the concepts of chapter 2 of the lecture notes. b) Suppose that the market wage (price of an hour of work) happens to be $15. i) Is this the equilibrium wage? If not, will the wage, the quantity demanded, and the quantity supplied remain unchanged and why? i) If not, how would the wage, the quantity demanded, and the quantity supplied change? Would they increase or decrease? iii) If they change, who will change the wage? iv) If you answer to question b.i) is no, what is the equilibrium wage and quantity demanded and supplied of labor? c) Recall that the surface of a triangle = (Base * Height) /2). Calculate i) the maximum total net social benefit at the equilibrium. i) Calculate the maximum total profit or total benefit of the employers at the equilibrium i) Calculate the producer's surplus (= workers' surplus) at the equilibrium wage at the equilibrium. iv) How much is the difference between the marginal social benefit and the marginal social cost at the equilibrium? d) How does the market divide the maximum total net social benefit between employers and workers? Is there any net social benefit left unclaimed? e) Suppose that the government imposes a minimum wage of $25 per hour but the government cannot force employers to employ more than the number of workers consistent with their demand curve. i) Is this minimum wage consistent with an efficient allocation of resources? How much is the difference if any between the marginal social benefit and the marginal social cost at the minimum wage? Which one is greater? 1) Calculate the maximum total net social benefit corresponding to the minimum wage g) Compare the total net social benefit before and after the imposition of the nominal wage. Who loses and who gains from the imposition of the minimum wage? Exercise 2 Suppose that the central bank of the US increases the interest rate in the US from 1% to 3% while the European central bank maintains its interest rate at 0.5%. Answer the following questions. Justify your answer using diagrams and the concepts developed in chapter 14 of the lecture notes. No numbers are required. a) What happens to net capital inflows to the US and net capital outflows out of the US? b) What should happen to the exchange rate of the US dollar in terms of the Euro, the European money? Use the demand and supply model to answer this question. c) What happens to US exports, imports and trade balance? d) Is it better to have a fixed exchange rate or a flexible exchange rate? Briefly explain your choice. EXERCISE 3 Read the description of certain events in the markets for selected products; predict the economic impact of these events on the corresponding demand curve, supply curve, equilibrium price and equilibrium quantity. Use the phrases shift left, shift right, shift up, shift down to indicate the effect on the demand and supply curves. It is an incorrect answer to use the expressions, the demand curve or supply curve increases or decreases. In some cases, the event may cause both the demand curve and the supply curve to shift and it is not possible to deduce a definite answer about either the equilibrium idclory Msoroecorem, Agment t ntroductory e cnomcs nt Wter 2021, 2/2021 10 22 AM 3. price or equilibrium quantity. You need not submit diagrams, but you should draw diagrams on a piece of paper to help you answer the questions correctly. Justify your answer using the concepts of chapter 2 of the lectr half the mark notes. Justification is worth Market Event (a) US automobile market US government revokes a tax on imports of cars from Mexico (b) January 2021 Next year's (2021) Wheat Market after the planting expected equilibrium price of wheat is now 20% lower season of 2021 crop has ended (c) Fast food Restaurants Studies show that obesity is not related to fast food served in fast food restaurants. (d) Canadian lumber market The US government imposes a tax on Canadian lumber imported by the US (e) Public The government of transportation the United Kingdom imposed a tax on access by cars to downtown London in London, UK.
Expert Answer:
Answer rating: 100% (QA)
ANSWER Part a Because column 3 accurately demonstrated a negative relationship between pay rate and ... View the full answer

Related Book For 
Posted Date:
Students also viewed these finance questions
-
Consider the following monthly returns. Year Month Return in (%) 2022 6 -0.1 2022 5 -10.3 2022 4 -14.7 2022 3 12.9 2022 2 13.7 2022 1 8.8 2021 12 11.2 2021 11 24.5 2021 10 30.2 2021 9 25.6 2021 8 5.2...
-
You are given the following data about a virtual memory system: (a)The TLB can hold 1024 entries and can be accessed in 1 clock cycle (1 nsec). (b) A page table entry can be found in 100 clock cycles...
-
You are given the following data on two companies, M and N (figures are millions): Required: a. Which company has the higher profit margin? b. Which company has the higher investment turnover? c....
-
What are the essential differences between victim and annex caches?
-
What should you know about yourself before you apply for jobs?
-
Delby Industries has manufactured prefabricated houses for over 20 years. The houses are constructed in sections to be assembled on customers lots. Delby expanded into the precut housing market when...
-
Consider the IRR and ERR measures of worth. If we define a root to mean a value for the measure that results in \(\mathrm{PW}=0\), then which of the following statements is true? a. Both IRR and ERR...
-
Diane Buswell is preparing the 2013 budget for one of Current Designs rotomolded kayaks. Extensive meetings with members of the sales department and executive team have resulted in the following unit...
-
You become interested in AT&T. Download the file PS4 from canvas. It contains monthly market returns (from CRSP) and monthly risk-free returns (from Fama and French). a. What is the AT&T beta? To...
-
Tammy Touchtone operates a talent agency called Touchtone Talent Agency. Some clients pay in advance for services; others are billed after services have been performed. Advance payments are credited...
-
A telegraph pole fell against a building. The foot of the pole is 23 feet away from the building and the top of the pole touches the building at a point 115 feet off the ground. What is the slope of...
-
How can your instructor expect you to figure out nursing diagnoses before you even see the patient or talk with him? 3. How does knowing the patient's medical diagnoses help you determine possible...
-
Determine the deflection at point C of the beam as shown. EI is constant. Note: tc/B is the moment of the M/El diagram between C and B about the point C. 10m B 60 kN 5 m
-
c. Intergenerational inequality and inequality in earnings between members of a population are positively correlated. Discuss two reasons that may explain this positive correlation. [max words: 250]...
-
Using the circuit below, answer the following questions. 1. Clearly state the Maximum Power Transfer Theorem. 2. Calculate the value of R3 for maximum power transfer. 3. Calculate the maximum power...
-
what is a firm's appropriate response to natural disasters? Reading: Idea Watch. 2018. "Giving After Disasters: When Corporate Aid Has the Most Impact." Harvard Business Review. And Rosegrant, S. and...
-
Patrick, an employer, prefers people of the minority groups irrespective of their actual qualification for a specific position in his company. This scenario exemplifies that Patrick practices _____....
-
U.S. households have become smaller over the years. The following table from the 2010 GSS contains information on the number of people currently aged 18 years or older living in a respondent's...
-
Compare RAID level 0 through 5 with respect to read performance, write performance, space overhead, and reliability.
-
What is the difference between a pure hypervisor and a pure microkernel?
-
When initializing a global variable in a multithreaded program, a common programming error is to allow a race condition where the variable can be initialized twice. Why could this be a problem?...
-
Long Weekend Ltd suffered a severe drop in sales and profit performance for the year ended 30 June 2019. The income statement revealed that net sales were $1 500 000 with a profit of $310 000. Unit...
-
TMP Human Resource Consulting had the following contribution margin income statement for the year ended 2019. Required Answer each of the following independent situations. (a) Explain how an...
-
Selcombe, Selcombe and Selcombe Media are three generations of the one family involved for nearly 50 years in providing public relations services. The firm is preparing its fees budget for the year...

Study smarter with the SolutionInn App