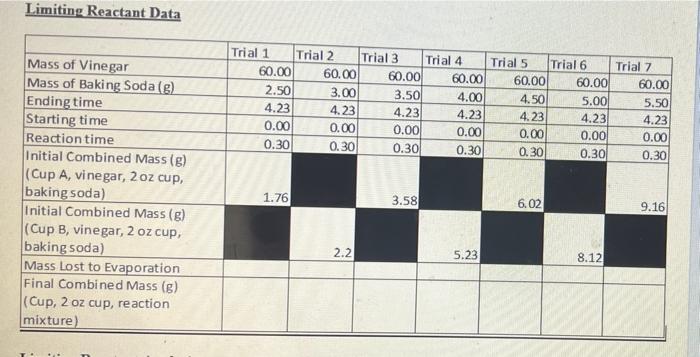
Complete the calculations in the Limiting Reactant Data Table document with the data obtained from the experiment.
2. Using Excel, prepare a graph of the mass of CO2 produced vs. the mass of the baking soda used, plotting only the points (do not connect the dots).
3. Using the necessary data from your results, use Excel to develop a mathematical relationship between the grams of baking soda reacted and mass of CO2 produced.
Note: Use only the points that make an approximately straight line. If there is more than one linear portion on your graph, plot a separate trendline for each portion of the graph. If there is not a level portion of the graph, you may use the average value of the data points that dont fit the linear plot for the relationship.
Using the shape of your graph and the mathematical relationship(s) developed in question 3, which reactant, if either, is the limiting reactant when smaller masses of baking soda are used? What about when larger masses of baking soda are used? Use the concept of limiting reactants to explain the shape of your graph.
5. Is the limiting reactant the same at the lower and higher masses of baking soda in your experiment? If not, at approximately what mass of baking soda does the limiting reactant switch?
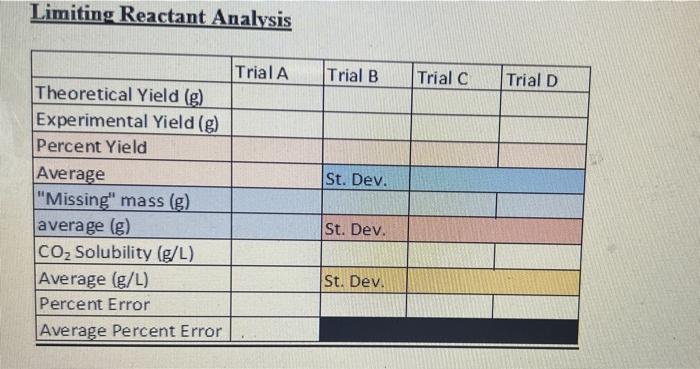
6. Pick four of your trials (two at the lower levels of baking soda (Trial A and B on the Data Tables document) and two at the higher mass trials (Trial C and Trial D) and calculate the theoretical yield of CO2 gas produced using either the baking soda or the acetic acid as the limiting reactant in your calculations depending on which data you are using. IMPORTANT NOTE: Vinegar is a 5.0% by mass aqueous acetic acid solution.
7. Calculate the percent yield for each trial you picked in question 6. How much mass of carbon dioxide is missing from your reaction? I.e. what is the mass difference between your percent yield and a 100% yield reaction?
8. Carbon dioxide is slightly soluble in water. Water is the major component of vinegar. Assuming all lost yield in the experiment was due to the carbon dioxide remaining dissolved in the vinegar and that the volume of vinegar was 60.0 mL in every trial, calculate the solubility of CO2 in your vinegar solution in units of g/L for each of the four trials you selected in question 6. Determine the average of your results.
9. The expected solubility for carbon dioxide at 250C in 1.4 g/L. Calculate a percent error for your average value from question 8.
10. There are, as in all experiments, some uncertainties in this lab. Explain some potential and known causes of error and/or inaccurate measurements in your experiment. How could you design a future experiment to reduce or even eliminate these errors or inaccuracies?
POSTLAB ACTIVITY
You will be turning in a lab report for this lab that should include a title, procedure, results, discussion, and references. The information that you obtained from the data analysis should be included at some point in the report. It is up to you whether it is in the results or discussion or both. However, remember that the report is more than just answering some questions and that it should flow smoothly and logically as you discuss the data obtained and what it signifies. Lab report guidelines for how to write the procedure, results, and discussion are found at the following links: Lab Reports and Sample Lab Report.
You will need to show sample calculations in the report. You may embed data tables which contain the formulas in calculated cells, you can create your own or use the Limiting Reactant Data Tables document. You will need to show these calculations for each step of one trial