

Question: Complete the cash disbursements from RM ------------------------------------------------------------- QUESTION : Complete the cash disbursements from RM Exhibit 1. Excel Data Input Section B B A Input
Complete the cash disbursements from RM
------------------------------------------------------------- QUESTION: Complete the cash disbursements from RM
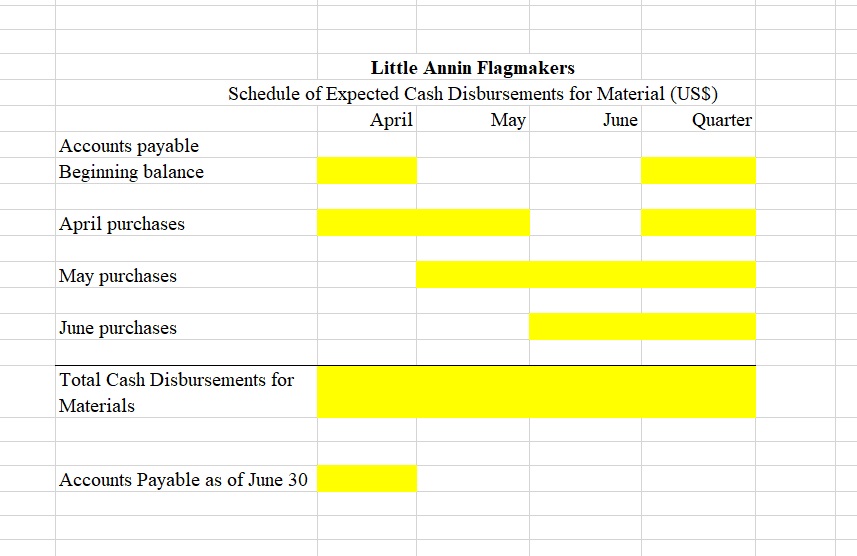
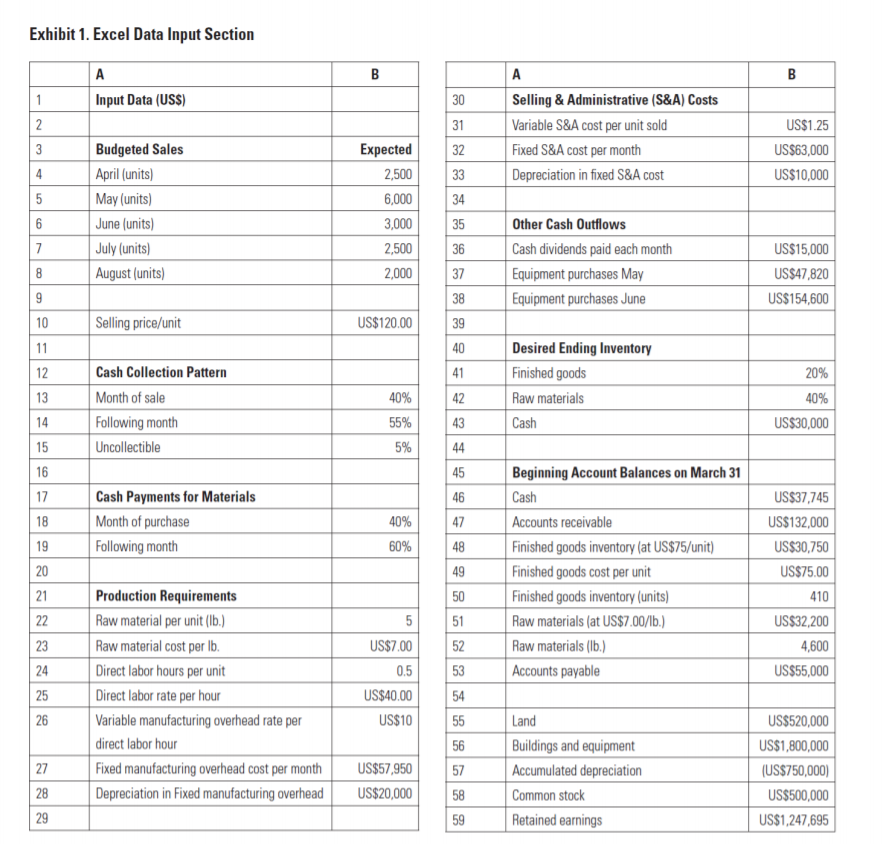
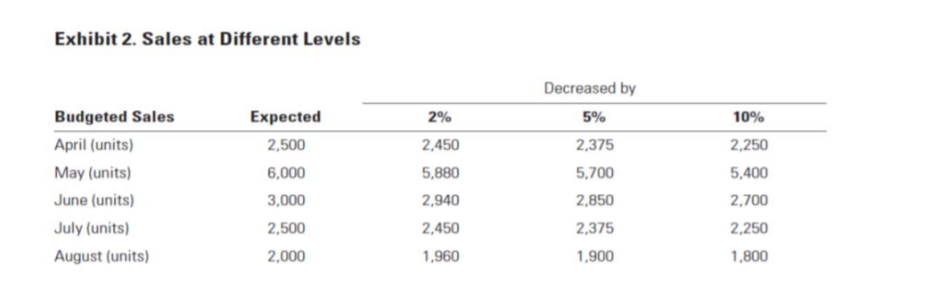
Exhibit 1. Excel Data Input Section B B A Input Data (USS) 30 1 2 31 32 A Selling & Administrative (S&A) Costs Variable S&A cost per unit sold Fixed S&A cost per month Depreciation in fixed S&A cost 3 US$1.25 US$63,000 US$10,000 4 33 5 34 Budgeted Sales April (units) May (units) June (units) July (units) August (units) Expected 2,500 6,000 3,000 2,500 2,000 6 35 36 7 Other Cash Outflows Cash dividends paid each month Equipment purchases May Equipment purchases June 8 37 38 US$15,000 US$47,820 US$154,600 9 10 Selling price/unit US$120.00 39 11 40 12 41 Desired Ending Inventory Finished goods Raw materials Cash 13 Cash Collection Pattern Month of sale Following month Uncollectible 42 20% 40% US$30,000 40% 55% 5% 14 43 15 44 16 45 17 46 18 Cash Payments for Materials Month of purchase Following month 40% 47 19 60% 48 20 49 Beginning Account Balances on March 31 Cash Accounts receivable Finished goods inventory (at US$75/unit) Finished goods cost per unit Finished goods inventory (units) Raw materials (at US$7.00/1b.) Raw materials (lb.) Accounts payable US$37,745 US$132,000 US$30,750 US$75.00 410 US$32,200 4,600 US$55,000 50 21 22 51 23 52 53 24 5 US$7.00 0.5 US$40.00 US$10 Production Requirements Raw material per unit (Ib.) Raw material cost per lb. Direct labor hours per unit Direct labor rate per hour Variable manufacturing overhead rate per direct labor hour Fixed manufacturing overhead cost per month Depreciation in Fixed manufacturing overhead 25 54 26 55 56 27 57 US$57,950 US$20,000 Land Buildings and equipment Accumulated depreciation Common stock Retained earnings US$520,000 US$1,800,000 (US$750,000) US$500,000 US$1,247,695 28 58 29 59 Exhibit 2. Sales at Different Levels Budgeted Sales April (units) May (units) June (units) July (units) August (units) Expected 2,500 6,000 3,000 2,500 2,000 2% 2,450 5,880 2,940 2,450 1,960 Decreased by 5% 2,375 5,700 2,850 2,375 1,900 10% 2,250 5,400 2,700 2,250 1,800 Little Annin Flagmakers Schedule of Expected Cash Disbursements for Material (USS) April May June Quarter Accounts payable Beginning balance April purchases May purchases June purchases Total Cash Disbursements for Materials Accounts Payable as of June 30
Step by Step Solution
There are 3 Steps involved in it

Get step-by-step solutions from verified subject matter experts