

Question: Complete the code cell below to make a graph of the data with error bars, along with the best fit line. The code cell above
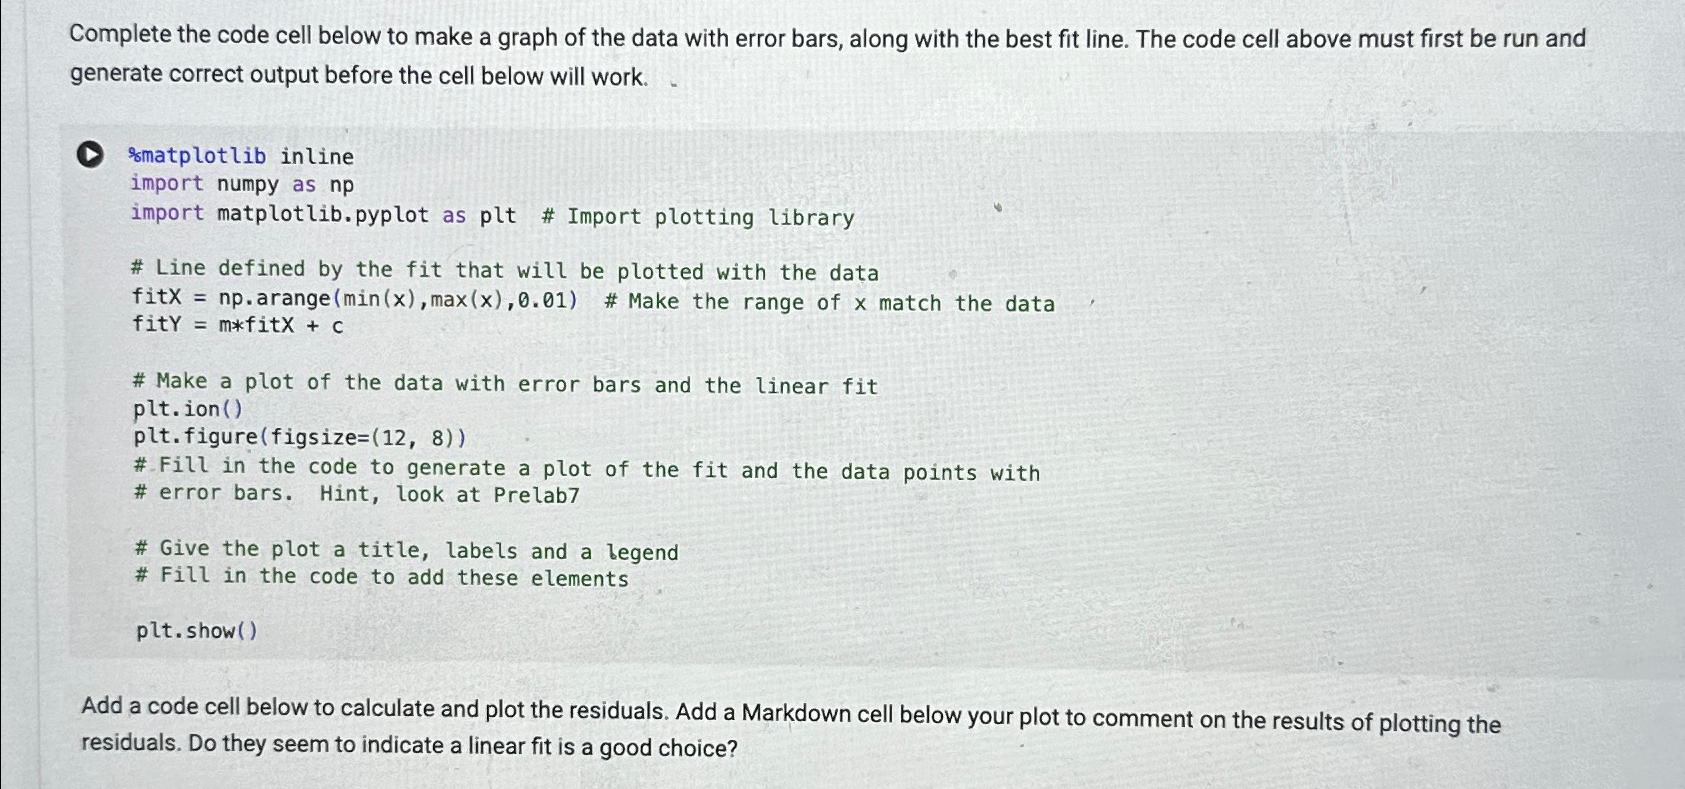
Complete the code cell below to make a graph of the data with error bars, along with the best fit line. The code cell above must first be run and generate correct output before the cell below will work.
matplotlib inline
import numpy as
import matplotlib.pyplot as plt # Import plotting library
# Line defined by the fit that will be plotted with the data
fitx arange max # Make the range of match the data
fity mfitX
# Make a plot of the data with error bars and the linear fit
pltion
plt figure figsize
#Fill in the code to generate a plot of the fit and the data points with
# error bars. Hint, look at Prelab
# Give the plot a title, labels and a legend
# Fill in the code to add these elements
pltshow
Add a code cell below to calculate and plot the residuals. Add a Markdown cell below your plot to comment on the results of plotting the residuals. Do they seem to indicate a linear fit is a good choice?
Step by Step Solution
There are 3 Steps involved in it
1 Expert Approved Answer
Step: 1 Unlock

Question Has Been Solved by an Expert!
Get step-by-step solutions from verified subject matter experts
Step: 2 Unlock
Step: 3 Unlock