

Question: In python, need it done ASAP please import matplotlib.pyplot as plt from PIL import Image as image import numpy as np import math def open_image(filename):
In python, need it done ASAP please
import matplotlib.pyplot as plt from PIL import Image as image import numpy as np import math
def open_image(filename): ''' This function using the PIL library and numpy library to open an image file and create a black and white numpy array :param filename: The name of the file :return: a black and white version of the image in a numpy array with values of 0 and 1 ''' im = image.open(filename) #open the image file im_hsv = im.convert(mode='HSV') #change it to HSV np_hsv = np.ceil(np.array(im_hsv)/255) # scale to 0 to 1 and make binary return (np_hsv[:, :, 2]) #return the v channel which is black and white def contains_pixel(im): ''' This function uses the numpy.all() function to detect if a numpy array corresponding to a fractal image contains a non-white pixel :param im: a black and white image in a numpy array :return: False if the image is all non zero, True if at least one element is zero ''' #doing this is faster than iterative becauses numpy if np.all(im): #np.all is True if all elements are not zero, if im contains a curve then np.all must be false return False #no curve detected else: return True #curve detected
def plot_line_fit(xt,yt): ''' This function plots a scatter plot of xt vs yt and does a best fit line :param xt: x values to be plotted :param yt: y values to be plotted :return: the slope of the best fit line ''' x = np.array(xt) y = np.array(yt) fit = np.polyfit(x,y,1) plt.scatter(x,y) plt.plot(x,fit[0]*x+fit[1]) plt.show() return(fit[0])
def split_into_four(im, level, level_count): #students write your own doc string and comments #This tells you the expected number of levels #use this to initialize a list with zeros using a list comprehension num_level = (round(math.log2(float(im.shape[0])/4)))
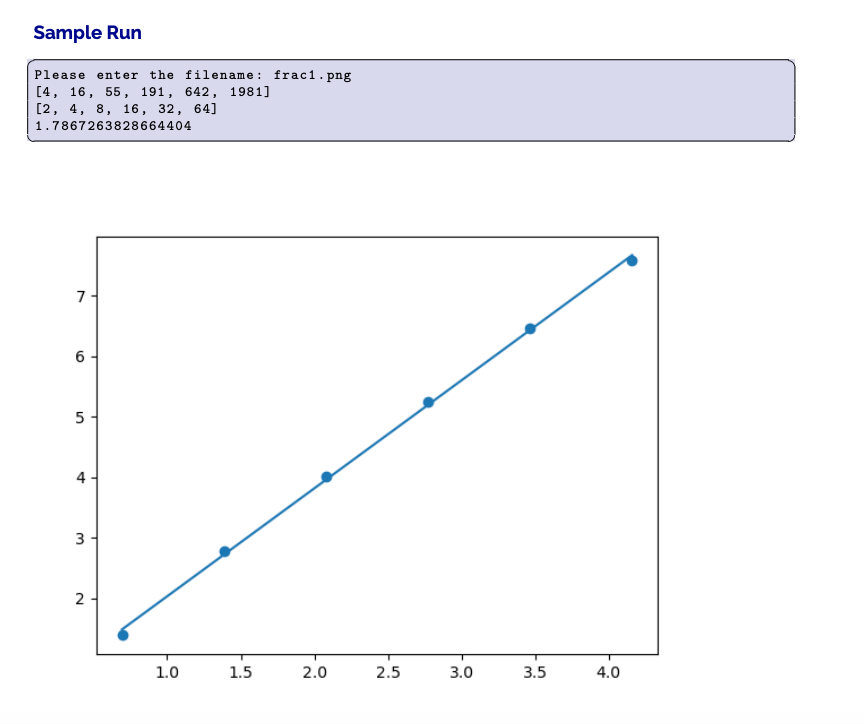
Representing the complexity of curves in two dimensional space is often done by calculating a fractal di- mension. For a curve in 2D space, calculating the fractal dimension returns a number between 1(a line) and 2 (a filled 2D shape). The closer the number is to two, the gnarlier and more complex the curve. This kind of calculation has direct application in geomatics, image processing, and spatial analytics. Some simple fractal curves can have their fractal dimension calculated from first principles. Most, however, require an approximation. One popular approximation is the box counting method. 2 Box counting covers an image with boxes, like tiles, then asks how many boxes contain the curve. The pro- cess is repeated for ever smaller boxes, until enough points are found to calculate the dimension according to: dimboz (S) = log(Ne) (1) log(1/) where dimboz (S) is the fractal dimension, N is the number of boxes containing the curve at the scale of e, and 17e is the inverse of the scale. In the following exercise, the scaling factor is always so the inverse will always be 2. A classic example of fractal dimension is determining the complexity of the British coastline, as shown in Fig 1. Knowing that we have to make a bunch of boxes and count pixels in them isn't necessarily recursive. You could imagine dividing an image up into squares, like tiles, then counting each iteratively from top left to bottom right, like reading in English. However, this can lead to issues if your increment or origin shifts. A potentially more principled way of making smaller squares is called a quadtree expansion. In a quadtree expansion, you take the original image, and divide it into four equal squares. (This often requires padding the image to be exactly square, but we will ignore this issue and assume we have a perfectly square image). Each square made from the first square is then further subdivided into four smaller squares, and so on, until a minimum number of pixels remains in each square. This forms a special kind of data structure called a tree, where the parent is made of four children, and so on down the line, making something that looks like a Christmas tree. By ensuring that all smaller squares are exactly contained in larger squares, issues related to origin and resolution choice can be reduced. An example of a quadtree geometry and part of the resulting tree are shown in Fig. 2.3 Program Design You have been provided with a starter file (a8q3-starter.py) which contains several functions. The first function open_image uses the PIL library to open an image, convert it to a numpy array, and make it binary (black and white). The output of this function is a numpy array containing 1 (for not part of a curve) or O (for part of a curve). Curves are drawn black on white, simply because they look cooler that way. The second function calculates whether or not a numpy array contains at least one zero by using the special numpy function texttttall() which literally checks to see if all elements of the provided array are not zero. Because we know that the curve is zero, if all() returns False then an image must contain at least some of the curve. Finally, you have been given a plot and fit function plot_line_fit which take x and y arrays (in this case the log of the inverse scale and box count) and plots those points and the best fit line through them. The slope of the line (which is an approximation of the dimension according to the equation above) is returned. Finally you have also been given the header of the main recursive function you have to write split_into_four, which takes an image, an integer corresponding to the level (how many splits) and list containing the counts for each level. In the main function area, you have been given the number of levels, which is based on a formula related to the size of the tree that is being built. You are required to write two pieces of code, one to complete the function split_into_four, and one to complete the main calls to perform the following: 1. prompt the user for the name of the file on the command line. 2. open an image using open_image. Several images of fractals have been supplied with the assignment. 3. use a list comprehension to create a list of num_levels length full of zeros to contain the count at each level and print the results. 4. use a list comprehension to initialize the scale variable. It should be the inverse of the length of one side. If the base case is 1, then the next scale would be 1/2, then 1/4, then 1/8 and so on, meaning your list should contain 2,4,8 and so on. 5. create a quadtree decomposition of the image and count the number of blocks at each level con- taining the curve by completing split_into_four, and print the returned results. Use a recursive implementation. The image should not be split if has no curve or if it is 4 pixels by 4 pixels or smaller. 6. plot log(scale) vs log/count) as in equation 1 using plot_line_fit and print the returned value. Items 1, 2, 3, and 5 are review in using functions, arrays and lists. Item 5 is the recursive portion of this assignment. Item 5 is both easy, and fiendishly difficult. If you try to hack your way through designing the recursion, you are likely to tie yourself in knots. This part of the question needs to be done on paper first, working carefully through the logic. Read the above closely, because it essentially tells you what to do. One of the elegant properties of recursion is how it can take difficult problems, and express the solution in a relatively small number of lines of code. My solution added 17 lines to the split_into_four function. Fewer lines are possible, but I went with a more readable version for the solution. If you have added more than 25 lines of code to split_into_four, you are probably headed in the wrong direction. HINT: numpy arrays have a property called shape, which returns a numpy array containing the number of elements in the array. For example if I had a two dimensional array with three rows and four columns then print(my_array.shape) would output [3,4]. This will come in handy when writing split_into_four. NOTE: The text before Program Design is meant to provide context. Everything you need to complete the assignment is in the Program Design section and the starter file. Don't get hung up on fractal dimension as if Sample Run Please enter the filename: frac1.png [4, 16, 55, 191, 642, 1981) [2, 4, 8, 16, 32, 64] 1.7867263828664404 7 6 5 4 3 2 1.0 1.5 2.0 2.5 3.0 3.5 4.0
Step by Step Solution
There are 3 Steps involved in it

Get step-by-step solutions from verified subject matter experts