

Question: complete the following (by hand): Order the data Min Value: Max value: First Quartile Median (Second Quartile) Third Quartile 90% of students are shorter than

complete the following (by hand):
- Order the data
- Min Value:
- Max value:
- First Quartile
- Median (Second Quartile)
- Third Quartile
- 90% of students are shorter than what height?
- Mean
- Standard deviation.
- A histogram of the dataset.
- Is this dataset positively or negatively skewed?
- What is the value of skewness, using pearsons skewness coefficient
- Utilizing Chebyshev's Theorem. At least 75% of students would be expected to be in-between which two heights?
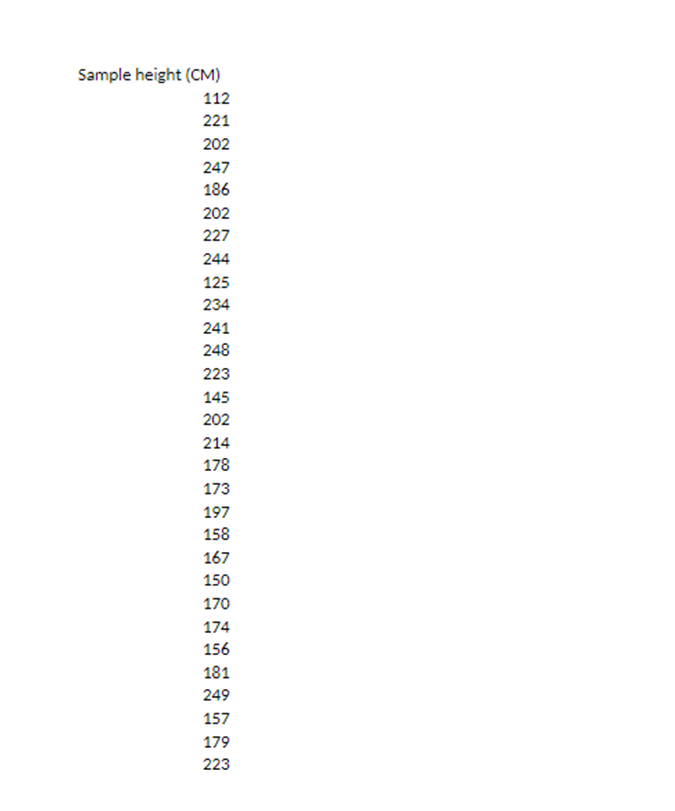
Sample height (CM) 112 221 202 247 186 202 227 244 125 234 241 248 223 145 202 214 178 173 197 158 167 150 170 174 156 181 249 157 179 223
Step by Step Solution
There are 3 Steps involved in it
1 Expert Approved Answer
Step: 1 Unlock

Question Has Been Solved by an Expert!
Get step-by-step solutions from verified subject matter experts
Step: 2 Unlock
Step: 3 Unlock