

Question: Complete the following Income Statement to include the percentages. Note: Total Sales is the base (100%) Sales Food Sales Beverage Sales Total Sales Cost
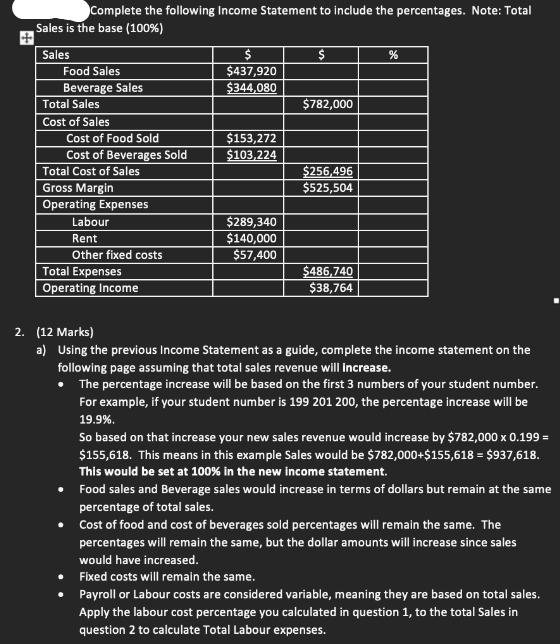
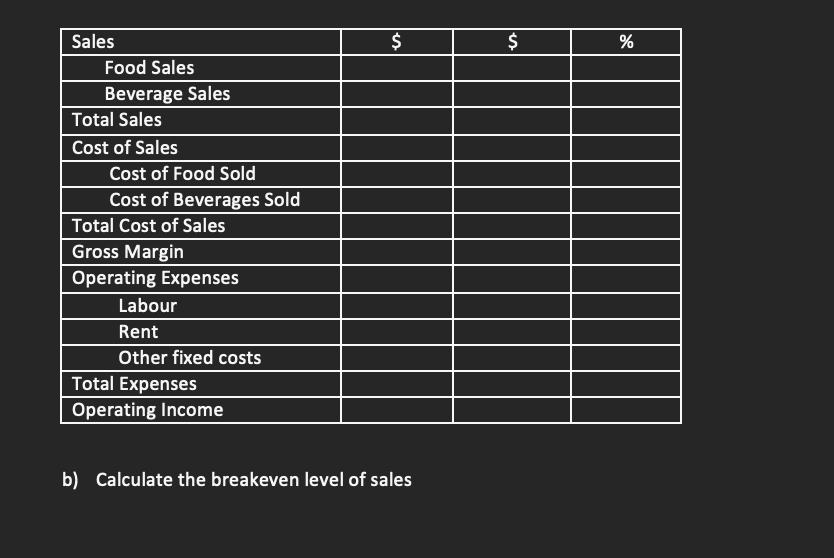
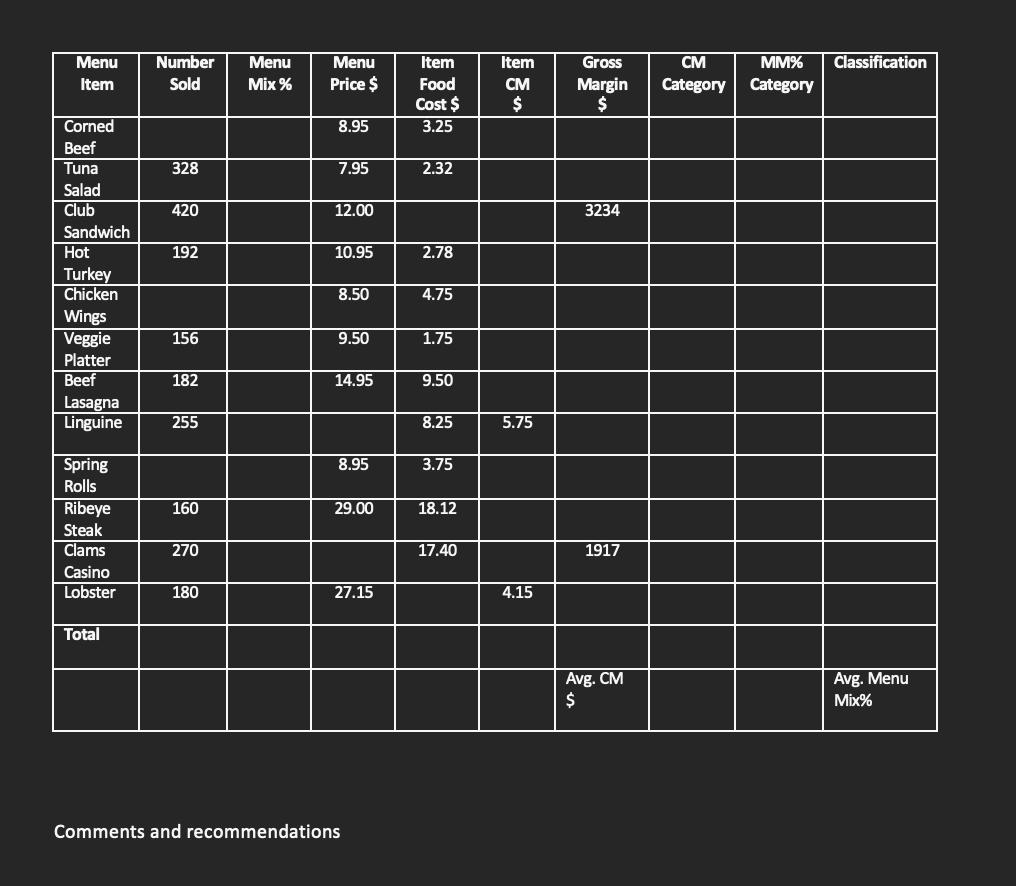
Complete the following Income Statement to include the percentages. Note: Total Sales is the base (100%) Sales Food Sales Beverage Sales Total Sales Cost of Sales Cost of Food Sold Cost of Beverages Sold Total Cost of Sales Gross Margin Operating Expenses Labour Rent Other fixed costs Total Expenses Operating Income $ $437,920 $344,080 $153,272 $103,224 $289,340 $140,000 $57,400 $ $782,000 $256,496 $525,504 $486,740 $38,764 % 2. (12 Marks) a) Using the previous Income Statement as a guide, complete the income statement on the following page assuming that total sales revenue will increase. The percentage increase will be based on the first 3 numbers of your student number. For example, if your student number is 199 201 200, the percentage increase will be 19.9%. So based on that increase your new sales revenue would increase by $782,000 x 0.199 = $155,618. This means in this example Sales would be $782,000+$155,618 = $937,618. This would be set at 100% in the new income statement. Food sales and Beverage sales would increase in terms of dollars but remain at the same percentage of total sales. Cost of food and cost of beverages sold percentages will remain the same. The percentages will remain the same, but the dollar amounts will increase since sales would have increased. Fixed costs will remain the same. Payroll or Labour costs are considered variable, meaning they are based on total sales. Apply the labour cost percentage you calculated in question 1, to the total sales in question 2 to calculate Total Labour expenses. Sales Food Sales Beverage Sales Total Sales Cost of Sales Cost of Food Sold Cost of Beverages Sold Total Cost of Sales Gross Margin Operating Expenses Labour Rent Other fixed costs Total Expenses Operating Income $ b) Calculate the breakeven level of sales $ % 3. (14 Marks) a) Complete the menu engineering chart on the following page, and classify all the menu items. There are three missing numbers from this chart that you need to complete first. You are not provided with the number sold for three menu items, Corned Beef, Chicken Wings, and Spring Rolls Similar to question 2 we will use your student number to input these missing numbers. For this question the first 3 numbers of your student number will be the actual number of Corned Beef sold, the middle 3 numbers will be the actual number of chicken wings sold, and the last 3 numbers of your student number will be the actual number of Spring rolls sold. For example, if your student number is 199 201 200, Corned Beef sold will be 199, Chicken wings will be 201, and Spring rolls will be 200 b) Once the chart is completed, make your recommendations. In this section you must be specific with your analysis specific to this menu. Do not simply write out the definitions of the item classifications, or generic recommendations obtained by an internet search. If you suggest new prices to certain items, state them and why you are changing them. If you want to redesign the menu, show the new menu and why you are placing the items in different order. If you want to remove certain items and replace them, state reasons why, and what items you will add to the menu. Menu Item Corned Beef Tuna Salad Club Sandwich Hot Turkey Chicken Wings Veggie Platter Beef Lasagna Linguine Spring Rolls Ribeye Steak Clams Casino Lobster Total Number Sold 328 420 192 156 182 255 160 270 180 Menu Mix % Menu Price $ 8.95 7.95 12.00 10.95 8.50 9.50 14.95 8.95 29.00 27.15 Comments and recommendations Item Food Cost $ 3.25 2.32 2.78 4.75 1.75 9.50 8.25 3.75 18.12 17.40 Item CM $ 5.75 4.15 Gross Margin $ 3234 1917 Avg. CM $ CM Category MM% Category Classification Avg. Menu Mix%
Step by Step Solution
There are 3 Steps involved in it
To address your request we will first need to complete the income statement by applying the given percentage increase to the total sales revenue Lets assume your student number leads to a percentage i... View full answer

Get step-by-step solutions from verified subject matter experts