

Question: Complete the iRobot Corporation Financial Analysis Assignment (Excel Spreadsheet in Green highlighted cells) Calculate your financial ratios for the spreadsheet from Exhibits 1, 3 and
Complete the iRobot Corporation Financial Analysis Assignment (Excel Spreadsheet in Green highlighted cells)
Calculate your financial ratios for the spreadsheet from Exhibits 1, 3 and 4
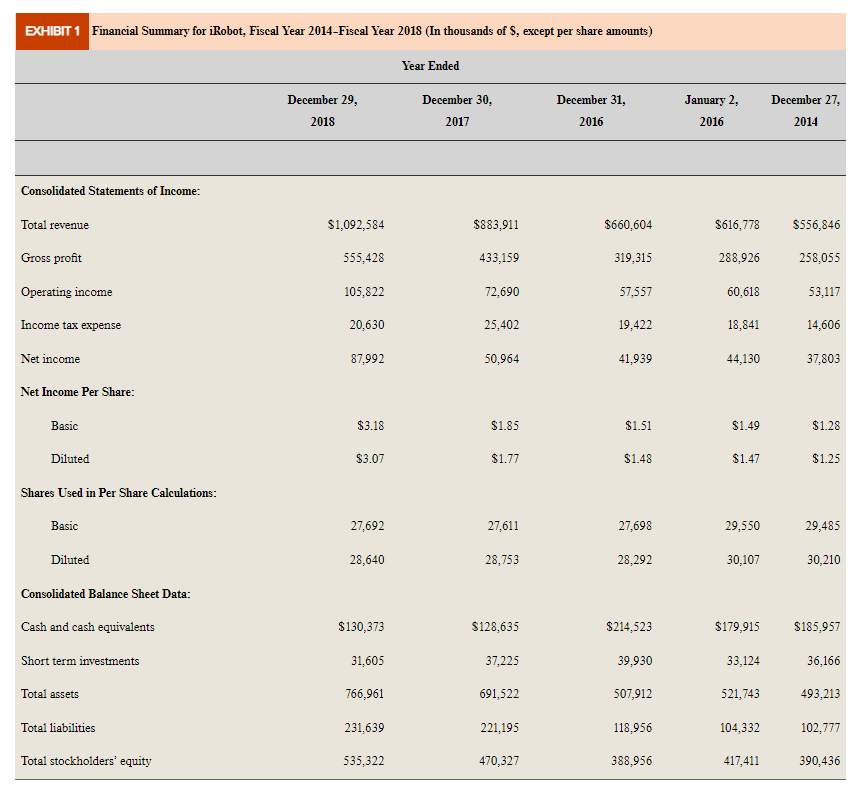
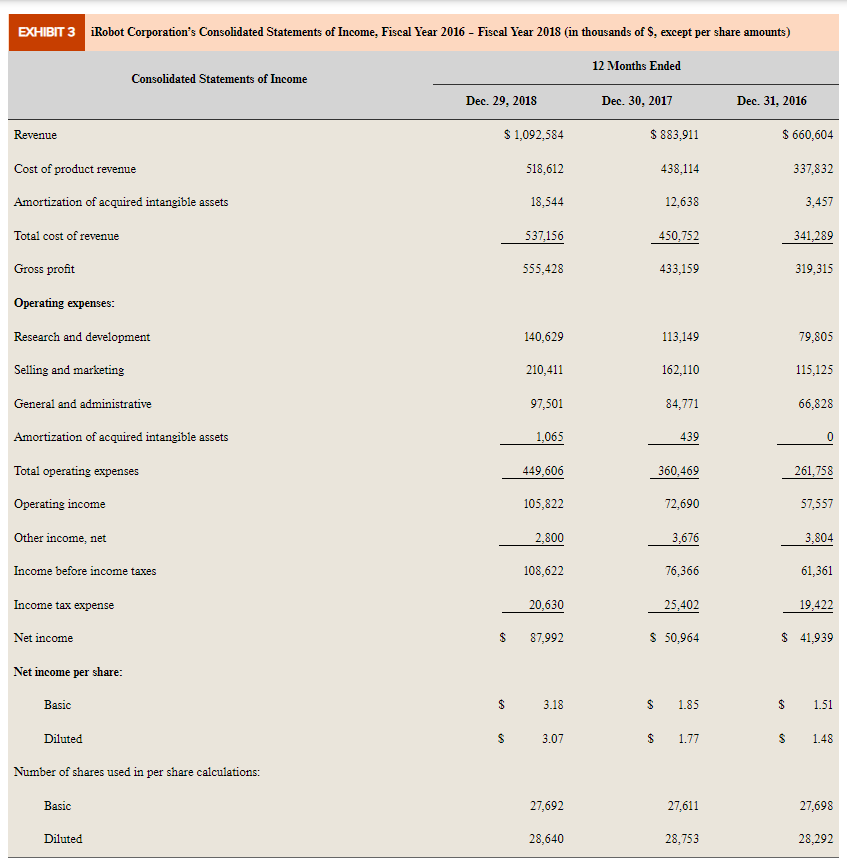
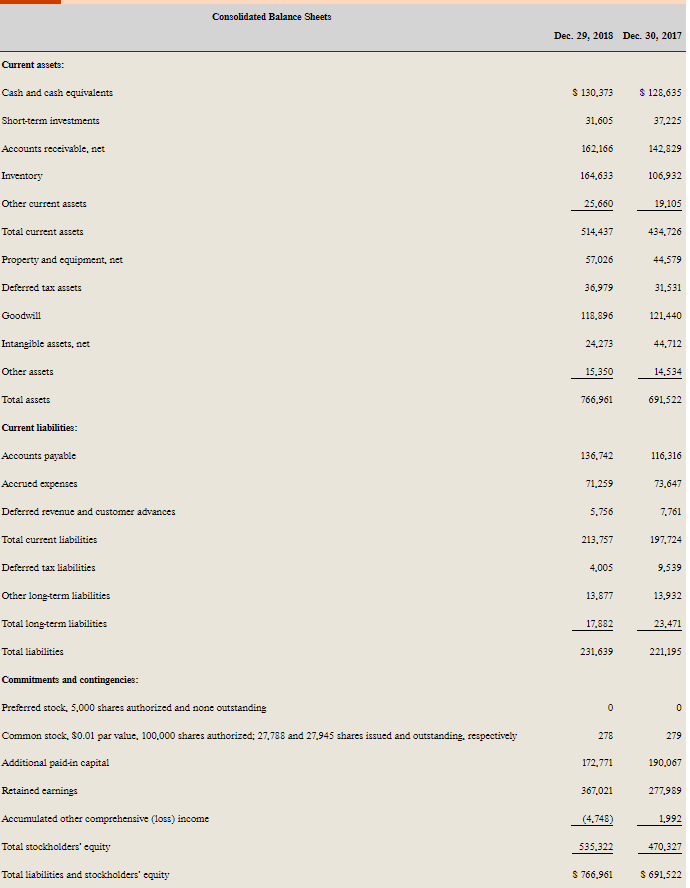
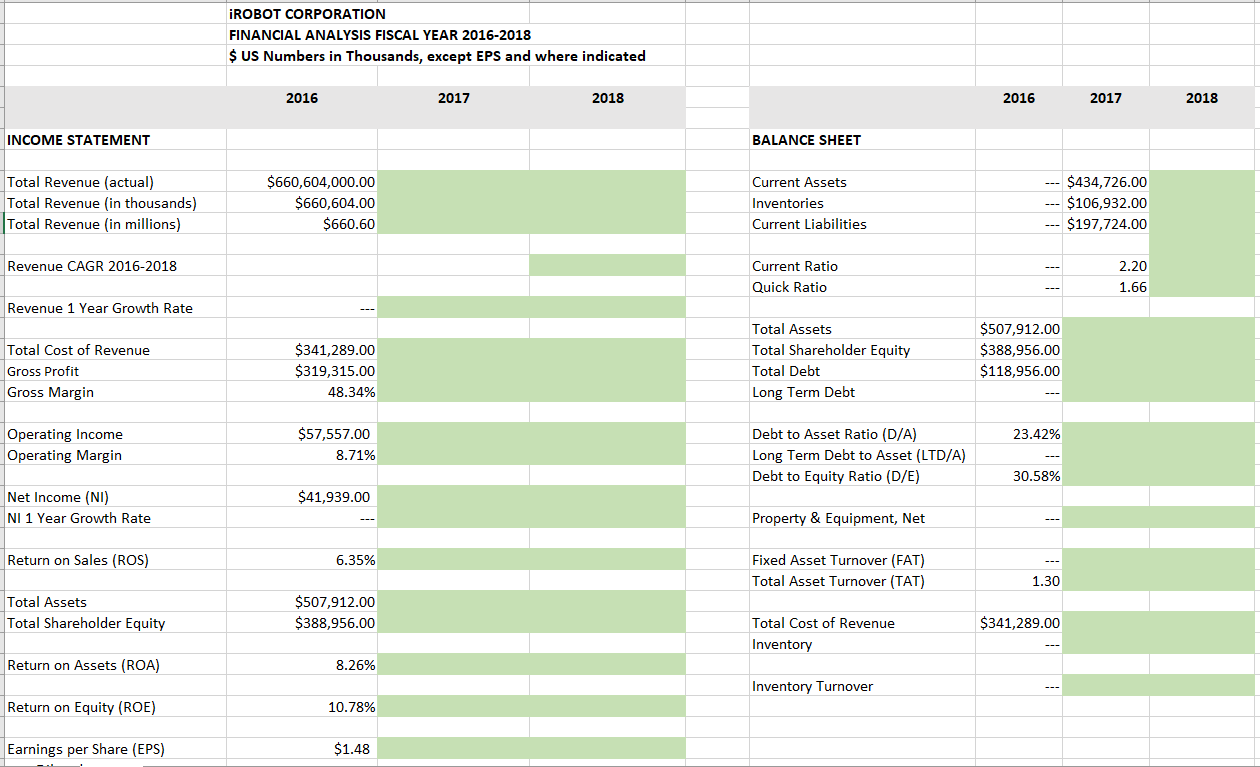
EXHIBIT 1 Financial Summary for iRobot, Fiscal Year 2014-Fiscal Year 2018 (In thousands of $, except per share amounts) Year Ended December 29, 2018 December 30, 2017 December 31, 2016 January 2, 2016 December 27, 2014 Consolidated Statements of Income: Total revenue $1,092,584 $883,911 $660,604 $616,778 $556,846 Gross profit 555,428 433,159 319,315 288,926 258,055 Operating income 105,822 72,690 57,557 60,618 53,117 Income tax expense 20,630 25,402 19,422 18,841 14,606 Net income 87,992 50,964 41,939 44,130 37,803 Net Income Per Share: Basic $3.18 $1.85 $1.51 $1.49 $1.28 Diluted $3.07 $1.77 $1.48 $1.47 $1.25 Shares Used in Per Share Calculations: Basic 27,692 27,611 27,698 29,550 29,485 Diluted 28,640 28,753 28,292 30,107 30,210 Consolidated Balance Sheet Data: Cash and cash equivalents $130,373 S128,635 $214,523 $179,915 $185,957 Short term investments 31,605 37,225 39,930 33,124 36,166 Total assets 766,961 691,522 507,912 521,743 493,213 Total liabilities 231,639 221,195 118,956 104,332 102,777 Total stockholders' equity 535,322 470,327 388,956 417,411 390,436 EXHIBIT 3 iRobot Corporation's Consolidated Statements of Income, Fiscal Year 2016 - Fiscal Year 2018 (in thousands of S. except per share amounts) 12 Months Ended Consolidated Statements of Income Dec. 29, 2018 Dec. 30, 2017 Dec 31, 2016 Revenue $ 1,092,584 $ 883,911 $ 660,604 Cost of product revenue 518,612 438.114 337,832 Amortization of acquired intangible assets 18,544 12,638 3,457 Total cost of revenue 537,156 450,752 341,289 Gross profit 555,428 433,159 319,315 Operating expenses: Research and development 140,629 113,149 79,805 Selling and marketing 210,411 162,110 115,125 General and administrative 97,501 84,771 66,828 Amortization of acquired intangible assets 1,065 439 0 Total operating expenses 449,606 360,469 261,758 Operating income 105,822 72,690 57,557 Other income, net 2,800 3,676 3,804 Income before income taxes 108,622 76,366 61,361 Income tax expense 20,630 25,402 19,422 Net income $ 87,992 $ 50,964 $ 41,939 Net income per share: Basic $ 3.18 $ 1.85 $ 1.51 Diluted S 3.07 $ 1.77 $ 1.48 Number of shares used in per share calculations: Basic 27,692 27.611 27,698 Diluted 28,640 28,753 28,292 Consolidated Balance Sheets Dec. 29, 2018 Dec. 30, 2017 Current assets: $ 130.373 $ 128,635 Cash and cash equivalents Short-term investments 31,605 37.225 162,166 142.829 Accounts receivable, net Inventory Other current assets 164,633 106,932 25.660 19,105 Total current assets 514,437 434,726 Property and equipment, net 57.026 44.579 Deferred tax assets 36,979 31,531 Goodwill 118.896 121,440 Intangible assets, net 24,273 44,712 Other assets 15,350 14,534 Total assets 766,961 691,522 Current liabilities: 136,742 116,316 Accounts payable Accrued expenses Deferred revenue and customer advances 71,259 73.647 5.756 7.761 Total current liabilities 213,757 197,724 4,005 9.539 Deferred tax liabilities Other long-term liabilities 13,877 13,932 Total long-term liabilities 17,882 23.471 Total liabilities 231.639 221,195 Commitments and contingencies: Preferred stock, 5.000 shares authorized and none outstanding 0 0 Common stock, 50.01 par value, 100.000 shares authorized: 27,786 and 27.945 shares issued and outstanding respectively 278 279 Additional paid.in capital 172.771 190,067 Retained earnings 367,021 277.989 Accumulated other comprehensive (loss) income (4.748) 1,992 Total stockholders' equity 535.322 470.327 Total liabilities and stockholders' equity $ 766,961 $ 691,522 iROBOT CORPORATION FINANCIAL ANALYSIS FISCAL YEAR 2016-2018 $ US Numbers in Thousands, except EPS and where indicated 2016 2017 2018 2016 2017 2018 INCOME STATEMENT BALANCE SHEET Total Revenue (actual) Total Revenue (in thousands) Total Revenue (in millions) $660,604,000.00 $660,604.00 $660.60 Current Assets Inventories Current Liabilities $434,726.00 $106,932.00 $197,724.00 Revenue CAGR 2016-2018 Current Ratio Quick Ratio 2.20 1.66 Revenue 1 Year Growth Rate Total Cost of Revenue Gross Profit Gross Margin $341,289.00 $319,315.00 48.34% Total Assets Total Shareholder Equity Total Debt Long Term Debt $507,912.00 $388,956.00 $118,956.00 23.42% Operating Income Operating Margin $57,557.00 8.71% Debt to Asset Ratio (D/A) Long Term Debt to Asset (LTD/A) Debt to Equity Ratio (D/E) 30.58% $41,939.00 Net Income (NI) NI 1 Year Growth Rate Property & Equipment, Net Return on Sales (ROS) 6.35% Fixed Asset Turnover (FAT) Total Asset Turnover (TAT) 1.30 Total Assets Total Shareholder Equity $507,912.00 $388,956.00 $341,289.00 Total Cost of Revenue Inventory Return on Assets (ROA) 8.26% Inventory Turnover Return on Equity (ROE) 10.78% Earnings per Share (EPS) $1.48
Step by Step Solution
There are 3 Steps involved in it

Get step-by-step solutions from verified subject matter experts