

Question: Complete the table below showing numeric summaries for the average ballpark attendance for 2015 and 2019 2015 attendance 43,467 2019 attendance 42,786 % of change
Complete the table below showing numeric summaries for the average ballpark attendance for 2015 and 2019
2015 attendance 43,467
2019 attendance 42,786
% of change -1.57%
I need to know the mean,minimum, first quartile,median, thrid quartile,maximum and standard devation for both years.
Mean
Minimum
First Quartile
Median
Third Quartile
Maximum
Standard Deviation
2015
2019
My team is the Cardinals this is the only information I have for this question.
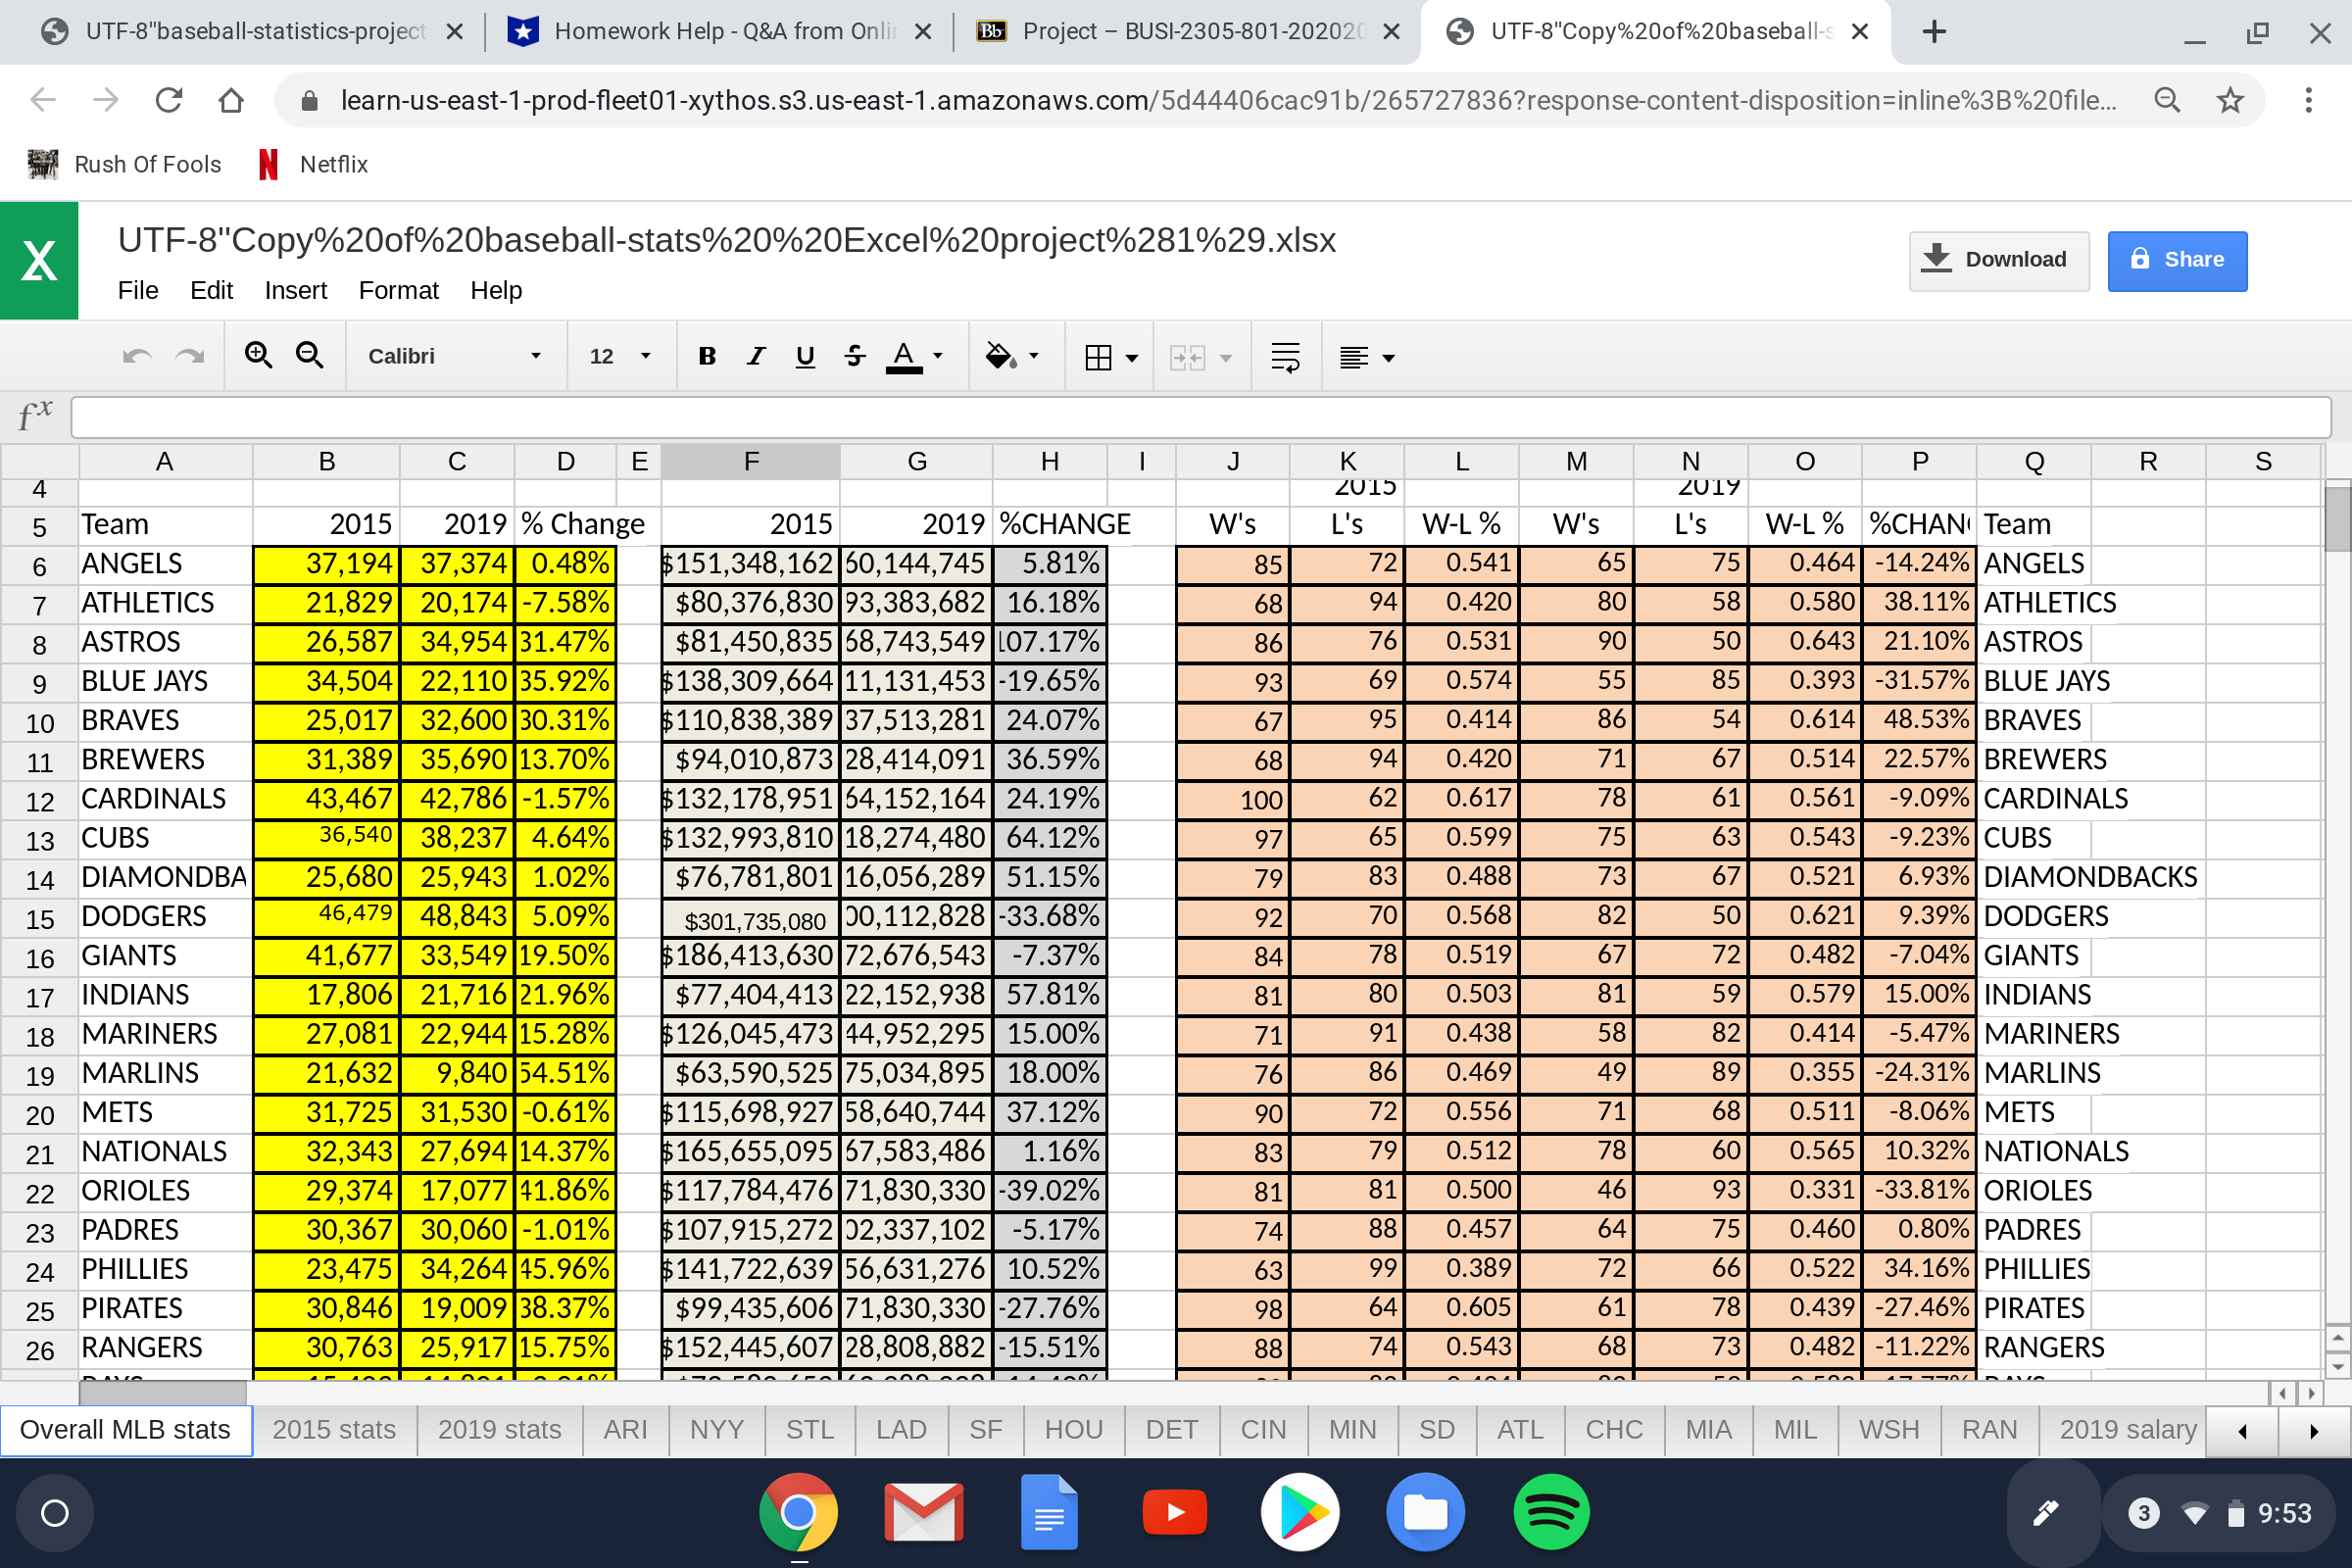
5 UTF-8"baseball-statistics-project X Homework Help - Q&A from Onli X Bb Project - BUSI-2305-801-202020 X UTF-8"Copy%20of%20baseball-s x + X learn-us-east-1-prod-fleet01-xythos.s3.us-east-1.amazonaws.com/5d44406cac91b/265727836?response-content-disposition=inline%3B%20file... Rush Of Fools Netflix X UTF-8"Copy%20of%20baseball-stats%20%20Excel%20project%281%29.xIsx File Edit Insert Format Help Download Share Calibri 12 " BIUSA. A. fx A B C D E F G H K L M N O P S ZOTY Q R Team 2015 2019 % Change 2015 2019 %CHANGE W'S L's W-L % L's W-L % %CHAN Team 6 ANGELS 37,194 37,374 0.48% 151,348, 162 60, 144,745 5.81% 35 72 0.541 65 75 0.464 -14.24% ANGELS ATHLETICS 21,829 20, 174 -7.58% $80,376,830 93,383,682 16.18% 68 94 .420 30 58 .580 38.11% ATHLETICS 8 ASTROS 26,587 34,954 31.47% $81,450,835 68,743,549 107.17% 86 76 0.531 90 50 0.643 21.10% ASTROS BLUE JAYS 34,504 22,110 35.92% $ 138,309,664 11,131,453 -19.65% 93 59 ).574 55 85 .393 -31.57% BLUE JAYS 10 BRAVES 25,017 32,600 30.31% $110,838,389 37,513,281 24.07% 67 95 0.414 86 54 0.614 48.53% BRAVES 11 BREWERS 31,389 35,690 13.70% $94,010,873 28,414,091 36.59% 68 94 0.420 71 67 0.514 22.57% BREWERS 12 CARDINALS 43,467 42,786 -1.57% $132,178,951 64, 152,164 24.19% 100 62 0.617 78 61 0.561 -9.09% CARDINALS CUBS 36,540 38,237 4.64% $132,993,810 18,274,480 64.12% 97 65 0.599 75 63 0.543 -9.23% CUBS 14 DIAMONDBA 25,680 25,943 1.02% $76,781,801 16,056,289 51.15% 79 83 0.488 67 0.521 5.93% DIAMONDBACKS 15 DODGERS 46,479 48,843 5.09% $301, 735,080 50, 112,828 -33.68% 92 70 0.568 82 50 0.621 9.39% DODGERS 16 GIANTS 41,677 33,549 19.50% $ 186,413,630 72,676,543 -7.37% 34 78 0.519 67 72 .482 -7.04% GIANTS 17 INDIANS 17,806 21,716 21.96% $77,404,413 22, 152,938 57.81% 81 80 0.503 81 59 0.579 15.00% INDIANS 18 MARINERS 27,081 22,944 15.28% $126,045,473 44,952,295 15.00% 71 91 0.438 58 82 0.414 -5.47% MARINERS 19 MARLINS 21,632 ,840 54.51% $63,590,525 75,034,895 18.00% 76 86 .469 49 89 ).355 -24.31% MARLINS 20 METS 31,725 31,530 -0.61% $115,698,927 58,640,744 37.12% 90 72 0.556 71 68 0.511 8.06% METS 21 NATIONALS 32,343 27,694 14.37% $165,655,095 67,583,486 1.16% 83 79 0.512 78 60 0.565 10.32% NATIONALS 22 ORIOLES 29,374 17,077 41.86% $117,784,476 71,830,330 -39.02% 81 81 0.500 46 93 .331 -33.81% ORIOLES PADRES 30,060 -1.01% $ 107,915,272 02,337,102 -5.17% 74 88 0.457 64 75 0.460 0.80% PADRES PHILLIES 23,475 34,264 45.96% $141,722,639 56,631,276 10.52% 53 99 .389 72 66 0.522 34.16% PHILLIES PIRATES 30,846 19,009 38.37% $99,435,606 71,830,330 -27.76% 98 64 0.605 61 0.439 -27.46% PIRATES 26 RANGERS 30,763 25,917 15.75% $ 152,445,607 28,808,882 -15.51% 38 74 0.543 68 73 .482 -11.22% RANGERS Overall MLB stats 2015 stats 2019 stats ARI NYY STL LAD SF HOU DET CIN MIN SD ATL CHC MIA MIL WSH RAN 2019 salary 3 9:53
Step by Step Solution
There are 3 Steps involved in it

Get step-by-step solutions from verified subject matter experts