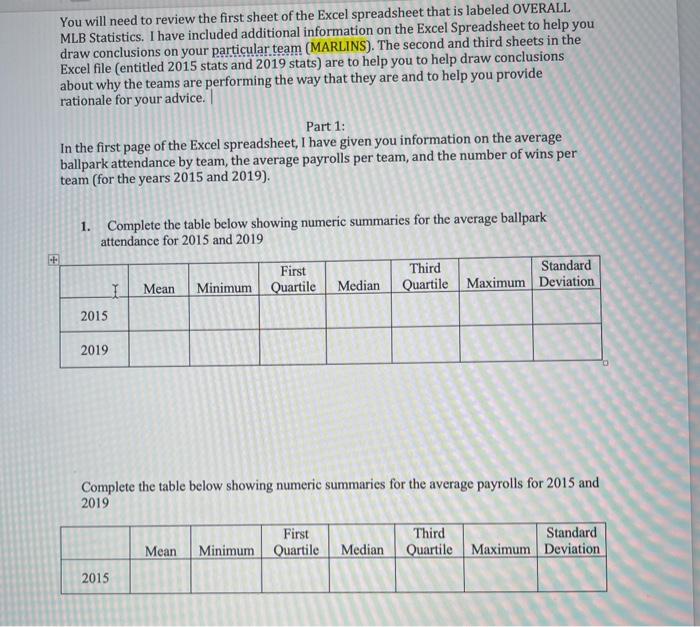
Question: Home Insert Draw Page Layout Formulas Data Review View Tell me Calibri (Body) 22 - A A Wrap Text General Paste B TV OA ===
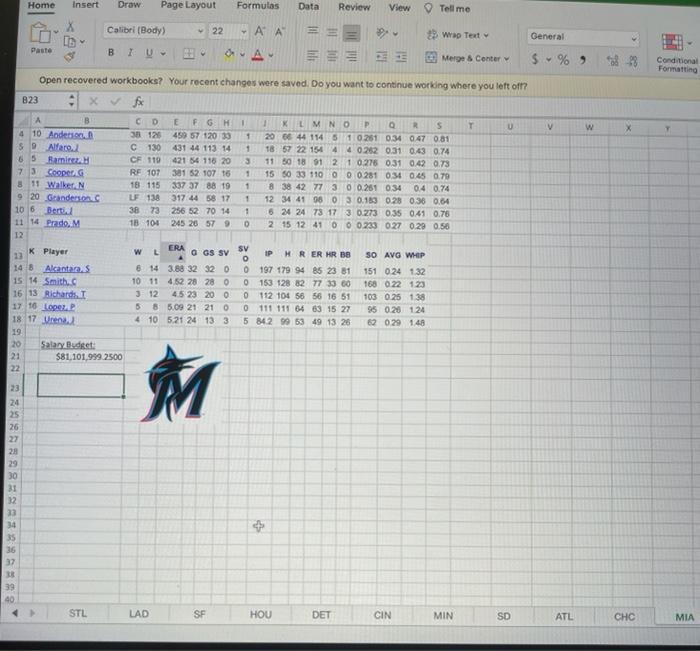
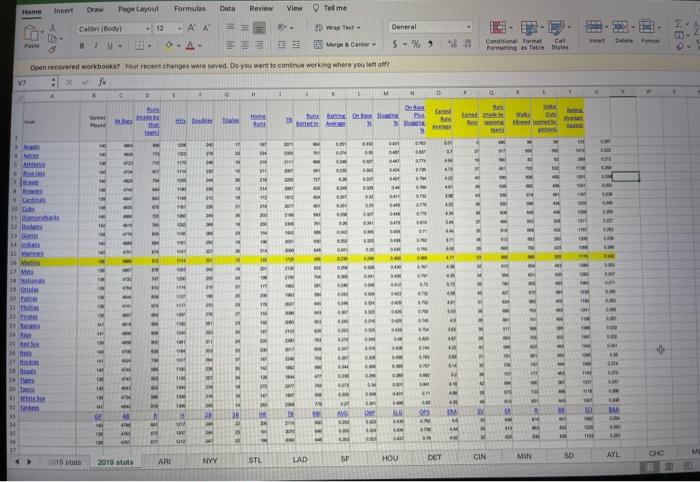
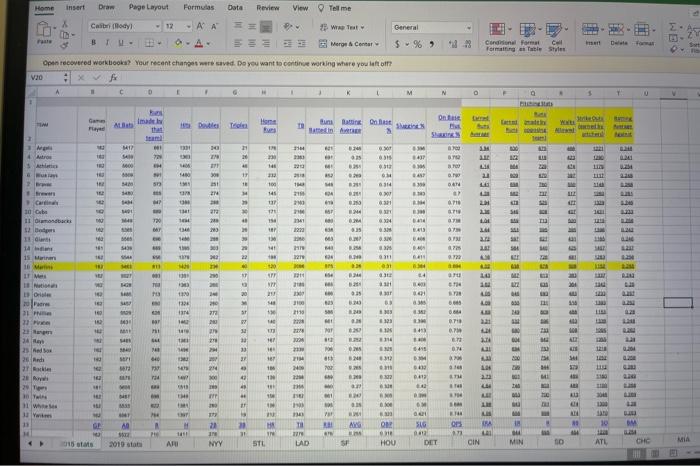
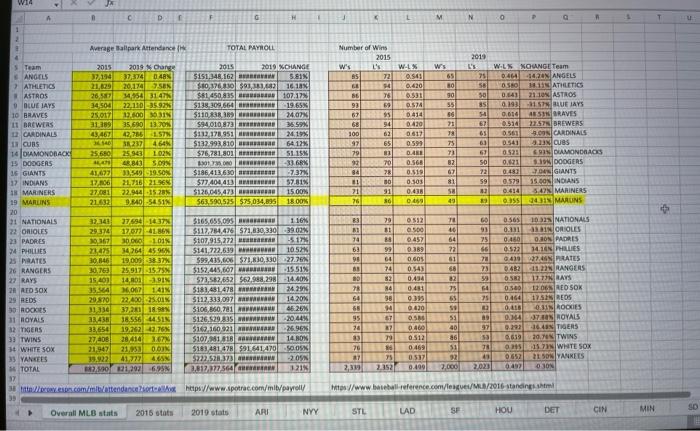
Home Insert Draw Page Layout Formulas Data Review View Tell me Calibri (Body) 22 - A A Wrap Text General Paste B TV OA === Merg & Center $ % 23 Conditional Formatting v w X Open recovered workbooks? Your recent changes were saved. Do you want to continue working where you left off? 823 x & fc B CD E F G H 1 1 K UMNO P R 5 T U 4 10 Anderson 33120 459 57 120 30 1 2006 44 114 5 1 0 251 0.34 0.47 0.81 $ Alfaro C 130 431 44 113 14 + 18 57 22 1544 4 0252 0.31 0.43 0.74 65 Ramirez CF 110 421 54 116 20 3 11 50 18 912 1 0.276 0.31 0.42 0.73 73 Cooper RE 107 381 52 107 16 1 1550 33 110 00 0.281 0.3 0.45 0.79 811 Walker N 18 115 337 37 88 19 1 8 38 42 77 30 0.251 0.34 04 0.74 9 20 Grandesson UF 138 317 448 17 1 12 34 41 06 03 0.153 0.28 0.38 0.64 10 6 Bert 38 73 256 52 70 14 1 6 24 24 78 17 30.273 0.55 0.41 0.76 11 14 Prado, M 13 104 245 26 579 0 2 15 12 41 00 0.233 0.27 0.29 0.58 12 K Player SV W ERA L 13 OGS SV IP HR ER HR BB SO AVG WHIP 14 8 Alcantara 614 388 32 320 0 197 179 94 85 23 81 151 0.24 1.32 15 14 Smith 10 11 452 28 28 0 153 128 82 77 33 60 168 022 123 16 13 Richard 312 45 23 200 112 104 56 56 16 51 103 025 138 17 10 Lopez 5 8 5.09 21 21 O 0 111 111 64 63 15 27 95 0.20 124 18 17 Uren 4 10 5.21 24 13 3 5 842 99 53 49 13 26 62 029 148 19 20 Salary Budet: 21 $81,101,999 2500 22 >OOOOO 23 Engnumnnn M 24 25 26 28 29 30 31 32 23 34 35 36 37 + 39 40 STL LAD SF HOU DET CIN MIN SD ATL CHC MIA Insert Draw Home Page Layout Formulas Data Review View Tell me Cat Body 12 - A A General P = == = DS of 29 wrap Text recent De BE CH OA $% 9 22 6 % Conditional Format Farming sa On recovered workbooks? Your recent changes were ved Do you want to continue working where you left V : x FAX > 1 . D H 1 Ba Cat O Sun Wiki elle Trile HD WWW WISE WON NO MI al we TE H ME BU A BIE . w NE ST 40 21 HE re ARE LLIBRE 11 3 ON ELITELLER M 11 D Dede 13 D WE WE we wi 41 W IN PE IN IN M M M 12 M 18 18 30 H BRL 11 atiiiiiiibaaj3 RE Listen the 104 ME STEDER w we w WA - RE ME WE 25 ME M EN NITT R11-ELLE w EN WS ME IR 418 10 TS 1 NI 111! ME ME WEE FO RE H M 33 AVO VI GE H 22 05 ON RE RE F in DET CIN 50 ATL 2015 stats STE LAD SF HOU ARI NY MIN 2010 Home insert Draw Page Layout Formulas Data Review View Tell me Y Casbody -12 - AA General we Test Meron Center BTW- 6 % - 5 Consonal Format C Formatting able Styles Do DO 2 Open recovered workbooks? Your recent changes were saved. Do you want to continue working where you shoff? vo 3 D M N O 0 T 0 WE Home On Tora Athe Wat Dette ayed a TO Bum Ben Watein She ha S 117 1 11 WO ENE WE 7 GE . M E re SA 000 T! 148 925 82 2 vo 097 in . HT VIT IT CFT VE NB SOC 1 & BEBE & . BAN SA sna HS PES 100 1 3 U ve w SPL MU CHE 4 MP 11 TIT TI NE HO 78 2N 2 . 20 TE EEEEEEEE 33 MET 101 10 Cuba 11 2 bers HARRRRRR LYLE re 4 7 720 OT EH 101 cer 150 er 10 141 12 ve 35 TUT NE VET WT TIT 18 BA . 9 CS www LE MO WEB HD 18 So ST IT 18 HITS 14 15 Maria 16 IT M IN 20 ATT 31 ET TE 14 net ET 20 TO 3 CH RE 2 201 TE w NE 20 21 SEO B. HO OTY 120 132 11 83 LO Orale om PN 22 630 SH 6. 0.6 12 1 3100 2110 TE W st 55 ENE 272 NO IVE MEE CH 10 TI IN 13 E-LEHDEEREEE REFERD SHEERERE EEEEEEEE 6 CH M BE WEE NI 11 w SO TE TRI 17 . E ON BE HE rt BE VO 6418 FOTO SI 21 82 30 JA 25 do 26 de 2 2 20 20 24 SEP 106 100 TATT TIT SON 702 BOS cura 16 TH w HT TET 4 LE Det GRE WE IRI M EEEEEERBIE TO TE STO HT 100 WB NE R IDO PA HY 13 E On OV 21 HA TB ANG SIG RA 10 We 20 HES it NE LE ARHI 2010 sati NYY STE LAD MIA SF HOU DET MIN CIN 03 ATI CHC IM D F G H H 1 > L M N 0 G 1 1 1 2 Average Ballpark Attendance TOTAL PAYROLL Number of Wins . W's WIM 1,1 Ws 65 80 ONSO 06 SS SB ITS NICOS 009 CE WEDNE GBE TE 86 73 2015 W.LOGANGE Team 25 0.468 14N ANGELS 58 ATHLETICS 50 0.14 21 10 ASTROS 0193 -3157 BLUE JAYS 0.010 4851 GRAVES 67 0.514 22.574 BREWERS 65 0561 ON CARDINALS 63 0.541 63 0523 IN DIAMONDBAGS 0.21 3.9N DOOGERS 72 0.480 GIANTS 0.579 15.GON INDIANS 0.414 5.42N, MARINERS BE 100 97 0.541 0.420 0.531 0524 414 0.410 0617 0599 DAS 0.560 0.519 0.50 0.438 0469 Seno NEG OS 75 TI 82 67 81 58 49 098 ECE SEE BEBERBER BEDRE FEESE & SEBEEF BESSER 09380 65 E SNOWW NIERE 4 0512 5 Team 2015 2019 One 2015 2019 %OUNGE ANGELS 37.194 37,374 DAN $151.348.162 DRAGON 5.813 7 ATHLETICS 21,629 20,174 3:58 $10,176 10 $91,181,683 16 10 ASTROS 26 34,75431471 $81 450.835 107.17 0 BLUE IAYS 34 504 22.110.92 $138 309,666 19,65% 10 BRAVES 25.017 $110 38 39 WARNA 11 BREWERS 35 590 13.703 $94010872 RUE 36:59% 2 CARDINALS 43,467 12,76 1.57N $112.171.951 HR M.19% 1 CUBS SR 230 4 64% $132.992 810 SHARE 64.12% 14 DIAMONDBACK 25.650 25 943 102N $76,781,801 ERR SIIN 15 DODGERS 14 GR 843 SON HER -33.68% 16 GUANTS 41,672 33,949 19.SON $186.413 630 H 7.37% 17 INDIANS 17.00 21.716 21:56 $77.404 413 WAHR 57.81% 18 MARINERS 27.01 22.948-3528 $126.045473 1500 19 MARLINS 21.632 9,840) -5451N 563.590,535 575034.895 18.0075 20 31 NATIONALS 32.141 27.694-14 $165,655,095 1 1611 22 ORIOLES 29374 17972-416N $112,784.470 571,010,330 3902 23 PADRES 0,367 30 000 101% $107,915,272 517 4 PHILLIES 23,475 34264459 $141.722.639 1057 25 PRATES 30.146 19.009 38 37% 599,435.00 $21,830, 33027.75 26 RANGERS 30.763 259171575 $152.445,607 27 RAYS 1540) 14.00 $73,582,652 $62.988.293 -14. 40 24 RED SOX 16.067 1.41% $181,481.478 24.29 29 REDS 29 870 22,400 25.01% $112.333,097 14 2015 30 ROCOS 21330 37,2 18.9 $106.860.781 AMAN 66 26% 11 ROYALS 33.438 18.556 SIN $126.929.835 AM 20.449 12 TIGERS 33,654 19.2421-42.765 5162,160.21 26.968 ) 27 DE 28.410 1.67 $107,881 318 14. NON 3+ WHITE SOX 21,67 0. $183,481 478 991 641 410 500 33 YANKEES 33,922 41,772 $222.328,373 CHAAR -2 OSN TOTAL 20121201 6.95% 2.812.127564GHETER 37 38 //y.com/it/attendance to https://www.potroc.com/mid/payroll 60 0050 STIONERE 75 99 0.457 0389 0.60 0.545 70 40 64 72 51 68 82 75 65 RR NISST 72 23 59 NIGE 19 430 0.481 56 103N NATIONALS 0.131 0460 ON PADRES 0.522 14.1 PHILLES 0.439 27.45 PRATES 0.432 112 RANGERS OSRE 12 IN RATS 050 12 RED SOK 0464175 REOS 0, 0,11 ROOGIES 0.14 37N ROYALS 164 TIGERS 6.619 30, TWINS 15NWHTE SOX 0652 0492 75 Otvo 65 64 55 95 70 I 97 reto 53 40 86 51 SNIMI EE CB OM 0460 0512 0.469 0.537 0.499 70 28 ESTE 76 37 2,319 CS HE EP 75 16 SHINANOSI NOCO NICE ZSEZ 7.000 2023 //www.bell reference.com/es/MB/2016 standing ARI Overall MLB stats 2015 stats NYY 2019 stats STL LAD SF CIN MIN HOU DET SD You will need to review the first sheet of the Excel spreadsheet that is labeled OVERALL MLB Statistics. I have included additional information on the Excel Spreadsheet to help you draw conclusions on your particular team (MARLINS). The second and third sheets in the Excel file (entitled 2015 stats and 2019 stats) are to help you to help draw conclusions about why the teams are performing the way that they are and to help you provide rationale for your advice. Part 1: In the first page of the Excel spreadsheet, I have given you information on the average ballpark attendance by team, the average payrolls per team, and the number of wins per team (for the years 2015 and 2019). 1. Complete the table below showing numeric summaries for the average ballpark attendance for 2015 and 2019 + First Minimum Quartile Third Standard Quartile Maximum Deviation Mean Median LI 2015 2019 Complete the table below showing numeric summaries for the average payrolls for 2015 and 2019 First Quartile Median Third Standard Quartile Maximum Deviation Mean Minimum 2015 Mean Minimum First Quartile Median Third Standard Quartile Maximum Deviation 2015 2019 2. Use the numeric summaries to determine if there are any outliers. Where do the MARLINS team fall? (in what quartile does your team fit into). 3. Construct a scatterplot on each of these charts above. Where does the MARLINS team fall? 4. Construct side-by-side boxplots based on the class five-number summaries.(for all 3 charts above) 5. What, if any, conclusions can be made to show that the there is a relationship between attendance, wins, and payroll? Discuss your conclusions and how the MARLINS team fits into this conclusion 6. What can be seen in the numeric summaries, boxplots, and scatterplots to make this conclusion? 7. What limitations are there to this study? That is, are there things that could be improved in order to obtain results that may be more reflective of the true values? 8. Was there a particular difference you noted overall and from the MARLINS tcam between 2015 and 20192 Home Insert Draw Page Layout Formulas Data Review View Tell me Calibri (Body) 22 - A A Wrap Text General Paste B TV OA === Merg & Center $ % 23 Conditional Formatting v w X Open recovered workbooks? Your recent changes were saved. Do you want to continue working where you left off? 823 x & fc B CD E F G H 1 1 K UMNO P R 5 T U 4 10 Anderson 33120 459 57 120 30 1 2006 44 114 5 1 0 251 0.34 0.47 0.81 $ Alfaro C 130 431 44 113 14 + 18 57 22 1544 4 0252 0.31 0.43 0.74 65 Ramirez CF 110 421 54 116 20 3 11 50 18 912 1 0.276 0.31 0.42 0.73 73 Cooper RE 107 381 52 107 16 1 1550 33 110 00 0.281 0.3 0.45 0.79 811 Walker N 18 115 337 37 88 19 1 8 38 42 77 30 0.251 0.34 04 0.74 9 20 Grandesson UF 138 317 448 17 1 12 34 41 06 03 0.153 0.28 0.38 0.64 10 6 Bert 38 73 256 52 70 14 1 6 24 24 78 17 30.273 0.55 0.41 0.76 11 14 Prado, M 13 104 245 26 579 0 2 15 12 41 00 0.233 0.27 0.29 0.58 12 K Player SV W ERA L 13 OGS SV IP HR ER HR BB SO AVG WHIP 14 8 Alcantara 614 388 32 320 0 197 179 94 85 23 81 151 0.24 1.32 15 14 Smith 10 11 452 28 28 0 153 128 82 77 33 60 168 022 123 16 13 Richard 312 45 23 200 112 104 56 56 16 51 103 025 138 17 10 Lopez 5 8 5.09 21 21 O 0 111 111 64 63 15 27 95 0.20 124 18 17 Uren 4 10 5.21 24 13 3 5 842 99 53 49 13 26 62 029 148 19 20 Salary Budet: 21 $81,101,999 2500 22 >OOOOO 23 Engnumnnn M 24 25 26 28 29 30 31 32 23 34 35 36 37 + 39 40 STL LAD SF HOU DET CIN MIN SD ATL CHC MIA Insert Draw Home Page Layout Formulas Data Review View Tell me Cat Body 12 - A A General P = == = DS of 29 wrap Text recent De BE CH OA $% 9 22 6 % Conditional Format Farming sa On recovered workbooks? Your recent changes were ved Do you want to continue working where you left V : x FAX > 1 . D H 1 Ba Cat O Sun Wiki elle Trile HD WWW WISE WON NO MI al we TE H ME BU A BIE . w NE ST 40 21 HE re ARE LLIBRE 11 3 ON ELITELLER M 11 D Dede 13 D WE WE we wi 41 W IN PE IN IN M M M 12 M 18 18 30 H BRL 11 atiiiiiiibaaj3 RE Listen the 104 ME STEDER w we w WA - RE ME WE 25 ME M EN NITT R11-ELLE w EN WS ME IR 418 10 TS 1 NI 111! ME ME WEE FO RE H M 33 AVO VI GE H 22 05 ON RE RE F in DET CIN 50 ATL 2015 stats STE LAD SF HOU ARI NY MIN 2010 Home insert Draw Page Layout Formulas Data Review View Tell me Y Casbody -12 - AA General we Test Meron Center BTW- 6 % - 5 Consonal Format C Formatting able Styles Do DO 2 Open recovered workbooks? Your recent changes were saved. Do you want to continue working where you shoff? vo 3 D M N O 0 T 0 WE Home On Tora Athe Wat Dette ayed a TO Bum Ben Watein She ha S 117 1 11 WO ENE WE 7 GE . M E re SA 000 T! 148 925 82 2 vo 097 in . HT VIT IT CFT VE NB SOC 1 & BEBE & . BAN SA sna HS PES 100 1 3 U ve w SPL MU CHE 4 MP 11 TIT TI NE HO 78 2N 2 . 20 TE EEEEEEEE 33 MET 101 10 Cuba 11 2 bers HARRRRRR LYLE re 4 7 720 OT EH 101 cer 150 er 10 141 12 ve 35 TUT NE VET WT TIT 18 BA . 9 CS www LE MO WEB HD 18 So ST IT 18 HITS 14 15 Maria 16 IT M IN 20 ATT 31 ET TE 14 net ET 20 TO 3 CH RE 2 201 TE w NE 20 21 SEO B. HO OTY 120 132 11 83 LO Orale om PN 22 630 SH 6. 0.6 12 1 3100 2110 TE W st 55 ENE 272 NO IVE MEE CH 10 TI IN 13 E-LEHDEEREEE REFERD SHEERERE EEEEEEEE 6 CH M BE WEE NI 11 w SO TE TRI 17 . E ON BE HE rt BE VO 6418 FOTO SI 21 82 30 JA 25 do 26 de 2 2 20 20 24 SEP 106 100 TATT TIT SON 702 BOS cura 16 TH w HT TET 4 LE Det GRE WE IRI M EEEEEERBIE TO TE STO HT 100 WB NE R IDO PA HY 13 E On OV 21 HA TB ANG SIG RA 10 We 20 HES it NE LE ARHI 2010 sati NYY STE LAD MIA SF HOU DET MIN CIN 03 ATI CHC IM D F G H H 1 > L M N 0 G 1 1 1 2 Average Ballpark Attendance TOTAL PAYROLL Number of Wins . W's WIM 1,1 Ws 65 80 ONSO 06 SS SB ITS NICOS 009 CE WEDNE GBE TE 86 73 2015 W.LOGANGE Team 25 0.468 14N ANGELS 58 ATHLETICS 50 0.14 21 10 ASTROS 0193 -3157 BLUE JAYS 0.010 4851 GRAVES 67 0.514 22.574 BREWERS 65 0561 ON CARDINALS 63 0.541 63 0523 IN DIAMONDBAGS 0.21 3.9N DOOGERS 72 0.480 GIANTS 0.579 15.GON INDIANS 0.414 5.42N, MARINERS BE 100 97 0.541 0.420 0.531 0524 414 0.410 0617 0599 DAS 0.560 0.519 0.50 0.438 0469 Seno NEG OS 75 TI 82 67 81 58 49 098 ECE SEE BEBERBER BEDRE FEESE & SEBEEF BESSER 09380 65 E SNOWW NIERE 4 0512 5 Team 2015 2019 One 2015 2019 %OUNGE ANGELS 37.194 37,374 DAN $151.348.162 DRAGON 5.813 7 ATHLETICS 21,629 20,174 3:58 $10,176 10 $91,181,683 16 10 ASTROS 26 34,75431471 $81 450.835 107.17 0 BLUE IAYS 34 504 22.110.92 $138 309,666 19,65% 10 BRAVES 25.017 $110 38 39 WARNA 11 BREWERS 35 590 13.703 $94010872 RUE 36:59% 2 CARDINALS 43,467 12,76 1.57N $112.171.951 HR M.19% 1 CUBS SR 230 4 64% $132.992 810 SHARE 64.12% 14 DIAMONDBACK 25.650 25 943 102N $76,781,801 ERR SIIN 15 DODGERS 14 GR 843 SON HER -33.68% 16 GUANTS 41,672 33,949 19.SON $186.413 630 H 7.37% 17 INDIANS 17.00 21.716 21:56 $77.404 413 WAHR 57.81% 18 MARINERS 27.01 22.948-3528 $126.045473 1500 19 MARLINS 21.632 9,840) -5451N 563.590,535 575034.895 18.0075 20 31 NATIONALS 32.141 27.694-14 $165,655,095 1 1611 22 ORIOLES 29374 17972-416N $112,784.470 571,010,330 3902 23 PADRES 0,367 30 000 101% $107,915,272 517 4 PHILLIES 23,475 34264459 $141.722.639 1057 25 PRATES 30.146 19.009 38 37% 599,435.00 $21,830, 33027.75 26 RANGERS 30.763 259171575 $152.445,607 27 RAYS 1540) 14.00 $73,582,652 $62.988.293 -14. 40 24 RED SOX 16.067 1.41% $181,481.478 24.29 29 REDS 29 870 22,400 25.01% $112.333,097 14 2015 30 ROCOS 21330 37,2 18.9 $106.860.781 AMAN 66 26% 11 ROYALS 33.438 18.556 SIN $126.929.835 AM 20.449 12 TIGERS 33,654 19.2421-42.765 5162,160.21 26.968 ) 27 DE 28.410 1.67 $107,881 318 14. NON 3+ WHITE SOX 21,67 0. $183,481 478 991 641 410 500 33 YANKEES 33,922 41,772 $222.328,373 CHAAR -2 OSN TOTAL 20121201 6.95% 2.812.127564GHETER 37 38 //y.com/it/attendance to https://www.potroc.com/mid/payroll 60 0050 STIONERE 75 99 0.457 0389 0.60 0.545 70 40 64 72 51 68 82 75 65 RR NISST 72 23 59 NIGE 19 430 0.481 56 103N NATIONALS 0.131 0460 ON PADRES 0.522 14.1 PHILLES 0.439 27.45 PRATES 0.432 112 RANGERS OSRE 12 IN RATS 050 12 RED SOK 0464175 REOS 0, 0,11 ROOGIES 0.14 37N ROYALS 164 TIGERS 6.619 30, TWINS 15NWHTE SOX 0652 0492 75 Otvo 65 64 55 95 70 I 97 reto 53 40 86 51 SNIMI EE CB OM 0460 0512 0.469 0.537 0.499 70 28 ESTE 76 37 2,319 CS HE EP 75 16 SHINANOSI NOCO NICE ZSEZ 7.000 2023 //www.bell reference.com/es/MB/2016 standing ARI Overall MLB stats 2015 stats NYY 2019 stats STL LAD SF CIN MIN HOU DET SD You will need to review the first sheet of the Excel spreadsheet that is labeled OVERALL MLB Statistics. I have included additional information on the Excel Spreadsheet to help you draw conclusions on your particular team (MARLINS). The second and third sheets in the Excel file (entitled 2015 stats and 2019 stats) are to help you to help draw conclusions about why the teams are performing the way that they are and to help you provide rationale for your advice. Part 1: In the first page of the Excel spreadsheet, I have given you information on the average ballpark attendance by team, the average payrolls per team, and the number of wins per team (for the years 2015 and 2019). 1. Complete the table below showing numeric summaries for the average ballpark attendance for 2015 and 2019 + First Minimum Quartile Third Standard Quartile Maximum Deviation Mean Median LI 2015 2019 Complete the table below showing numeric summaries for the average payrolls for 2015 and 2019 First Quartile Median Third Standard Quartile Maximum Deviation Mean Minimum 2015 Mean Minimum First Quartile Median Third Standard Quartile Maximum Deviation 2015 2019 2. Use the numeric summaries to determine if there are any outliers. Where do the MARLINS team fall? (in what quartile does your team fit into). 3. Construct a scatterplot on each of these charts above. Where does the MARLINS team fall? 4. Construct side-by-side boxplots based on the class five-number summaries.(for all 3 charts above) 5. What, if any, conclusions can be made to show that the there is a relationship between attendance, wins, and payroll? Discuss your conclusions and how the MARLINS team fits into this conclusion 6. What can be seen in the numeric summaries, boxplots, and scatterplots to make this conclusion? 7. What limitations are there to this study? That is, are there things that could be improved in order to obtain results that may be more reflective of the true values? 8. Was there a particular difference you noted overall and from the MARLINS tcam between 2015 and 20192