

Question: Complete the table below showing numeric summaries for the two types of words for the class. table [ [ , , Mean,Minimum, table
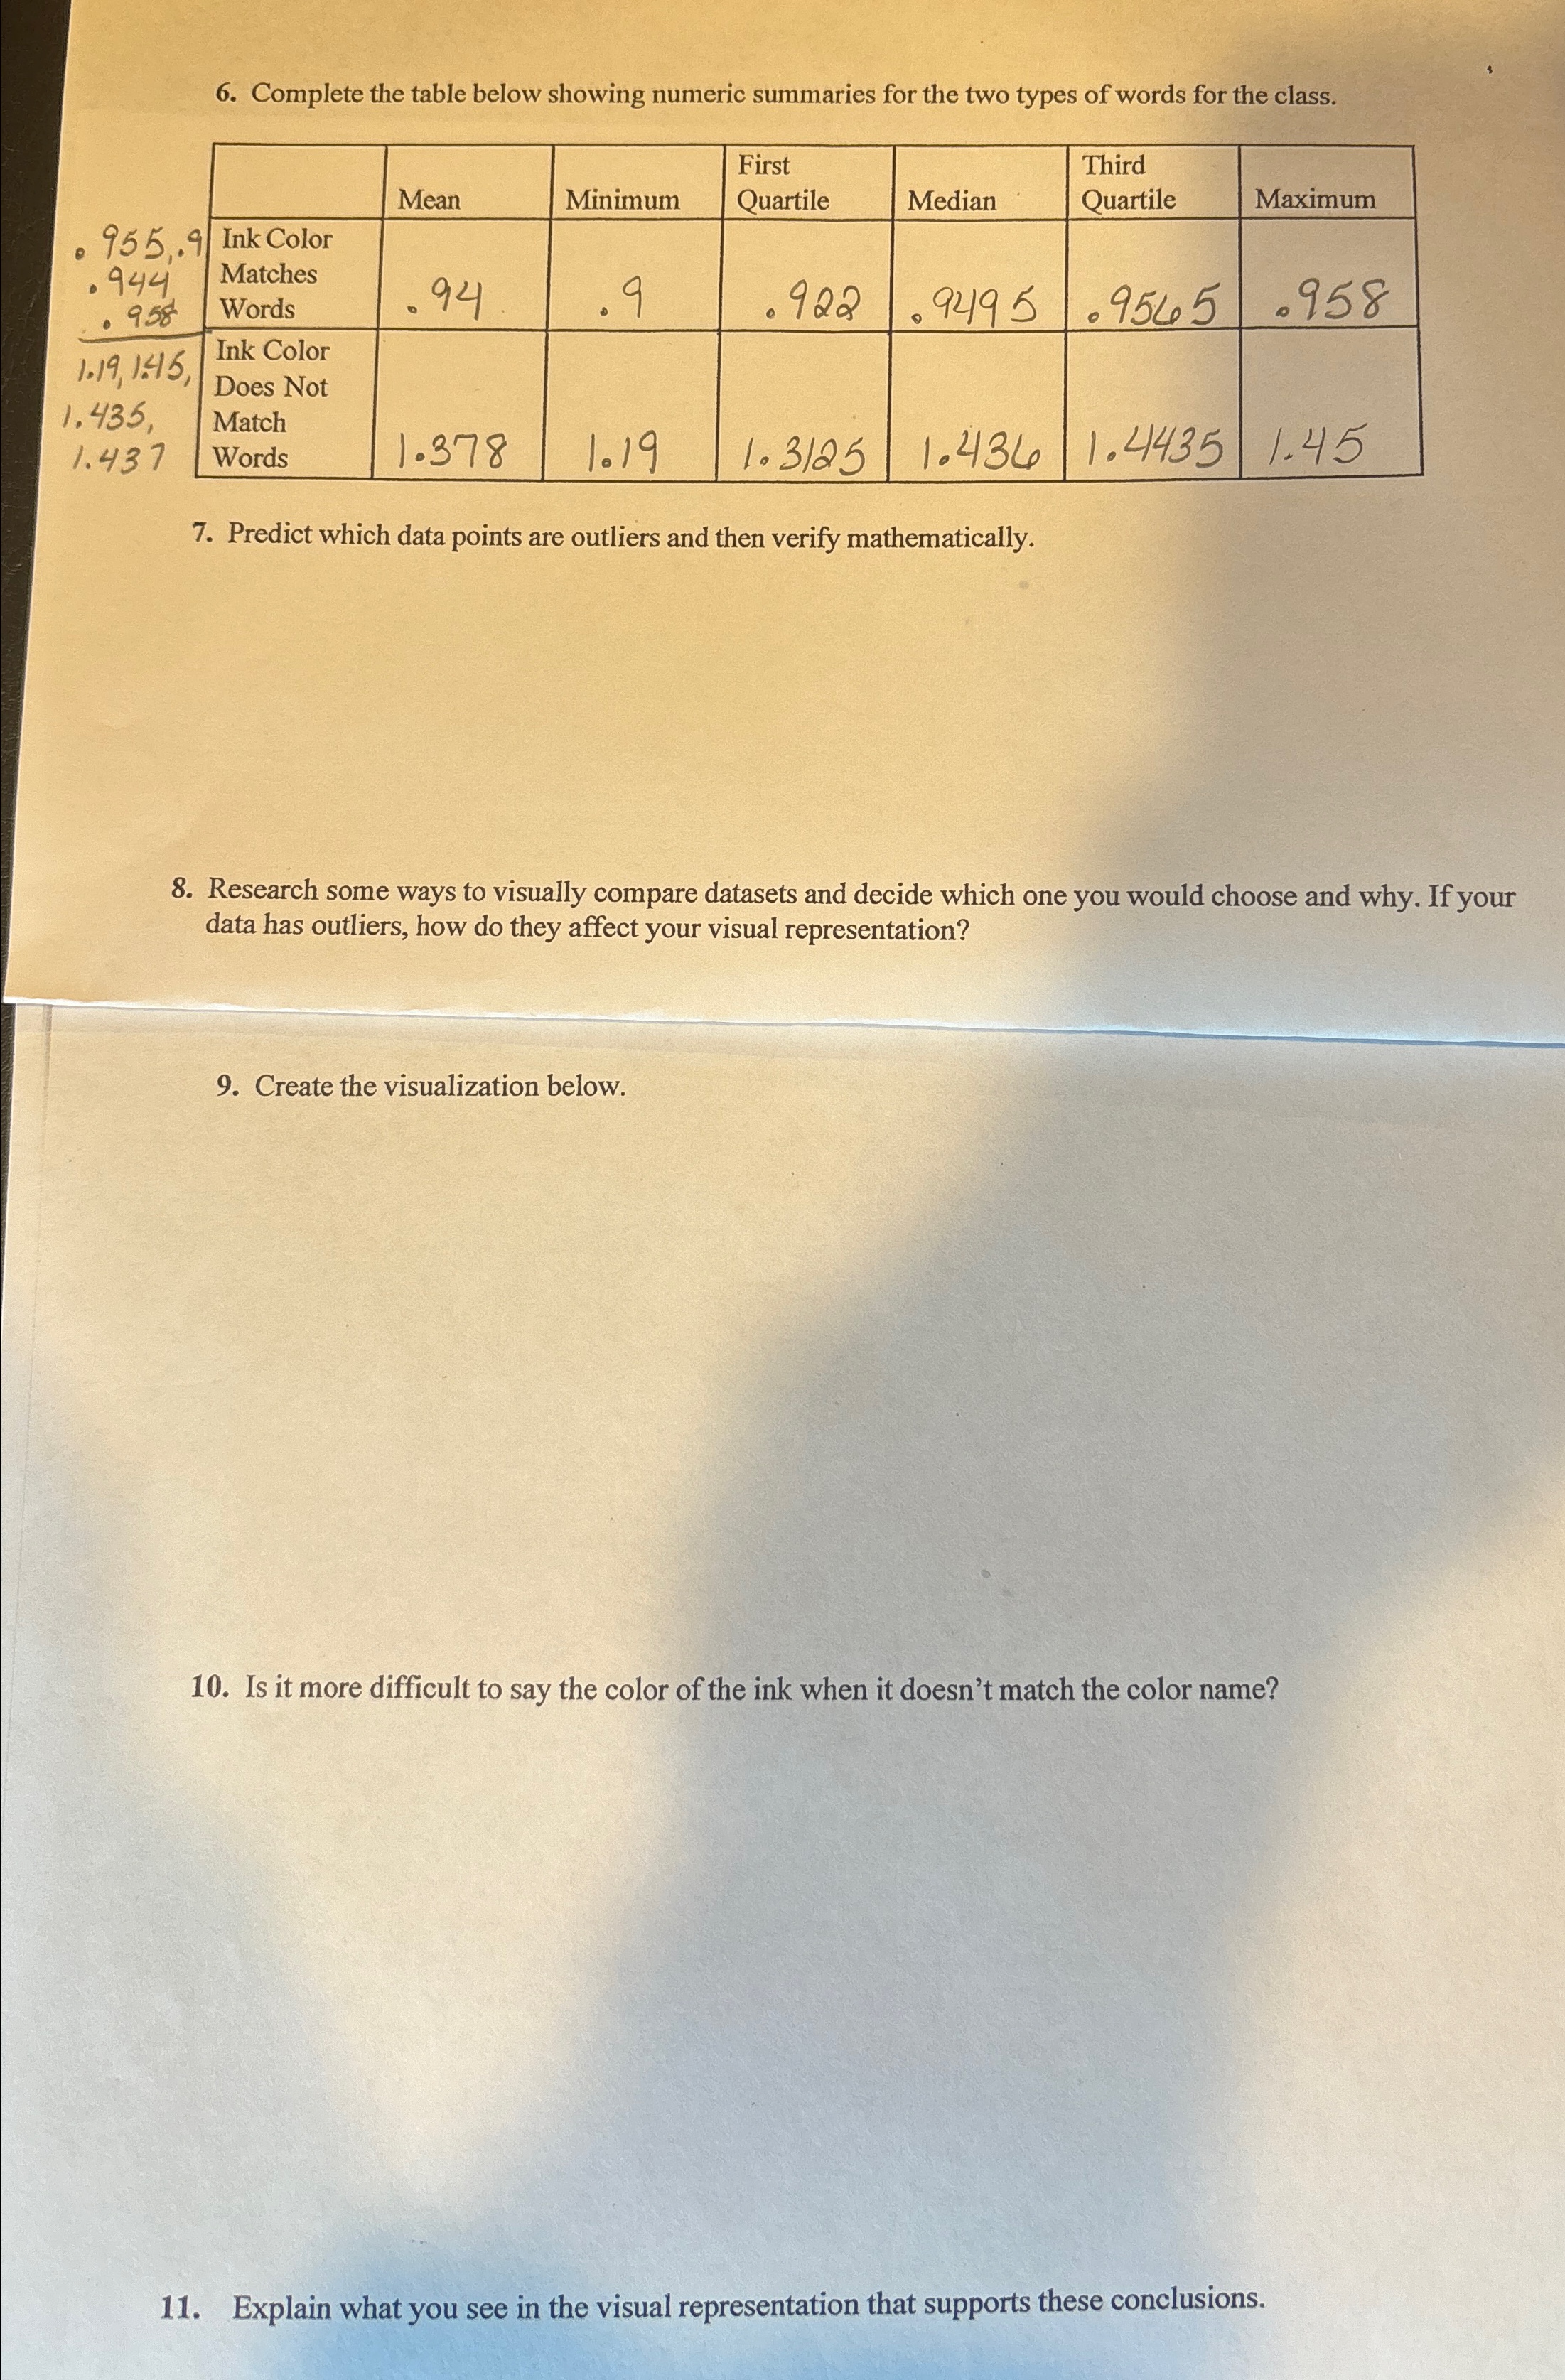
Complete the table below showing numeric summaries for the two types of words for the class.
tableMean,Minimum,tableFirstQuartileMedian,tableThirdQuartileMaximumtabletableInk ColorMatchesWordstabletableInk ColorDoes NotMatchWords
Predict which data points are outliers and then verify mathematically.
Research some ways to visually compare datasets and decide which one you would choose and why. If your data has outliers, how do they affect your visual representation?
Create the visualization below.
Is it more difficult to say the color of the ink when it doesn't match the color name?
Explain what you see in the visual representation that supports these conclusions.
Step by Step Solution
There are 3 Steps involved in it
1 Expert Approved Answer
Step: 1 Unlock

Question Has Been Solved by an Expert!
Get step-by-step solutions from verified subject matter experts
Step: 2 Unlock
Step: 3 Unlock