

Question: Complete the table below. Then draw the burn down chart with the completed data. Ideal Done Day Done Remaining Ideal Velocity Per Day Initial value
Complete the table below. Then draw the burn down chart with the completed data.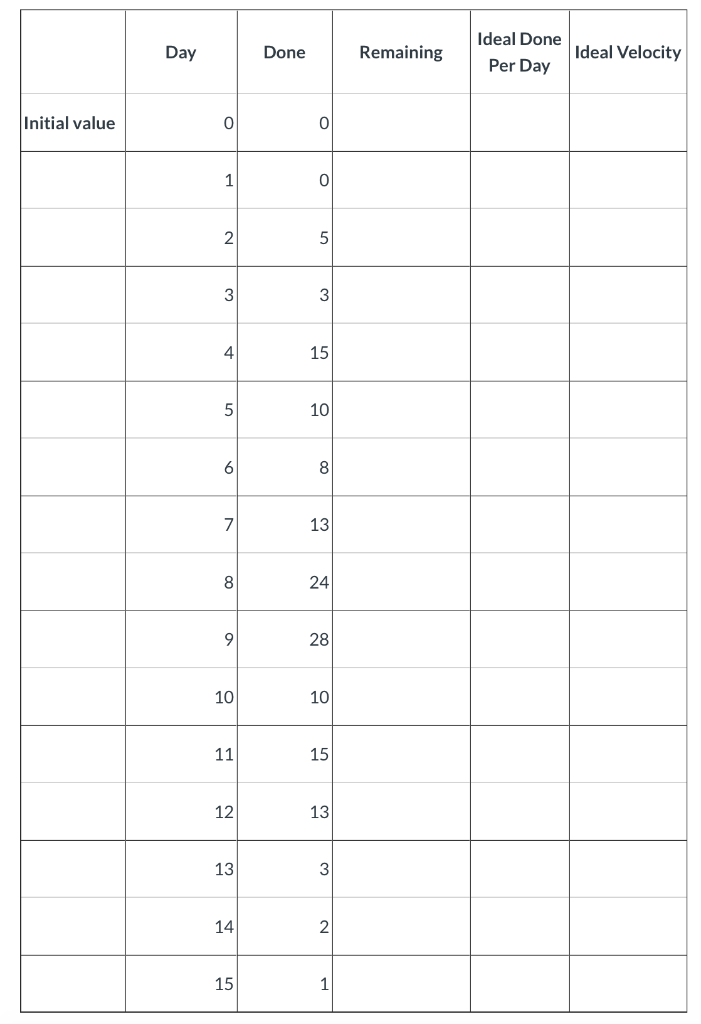
Step by Step Solution
There are 3 Steps involved in it
1 Expert Approved Answer
Step: 1 Unlock

Question Has Been Solved by an Expert!
Get step-by-step solutions from verified subject matter experts
Step: 2 Unlock
Step: 3 Unlock