Question: Complete the table given this information as well Revised Initial Cost $500,000Annual Revenuesno changeAnnual Costs (Excluding Depreciation) except for the year the overhaul is completed,
Complete the table given this information as well
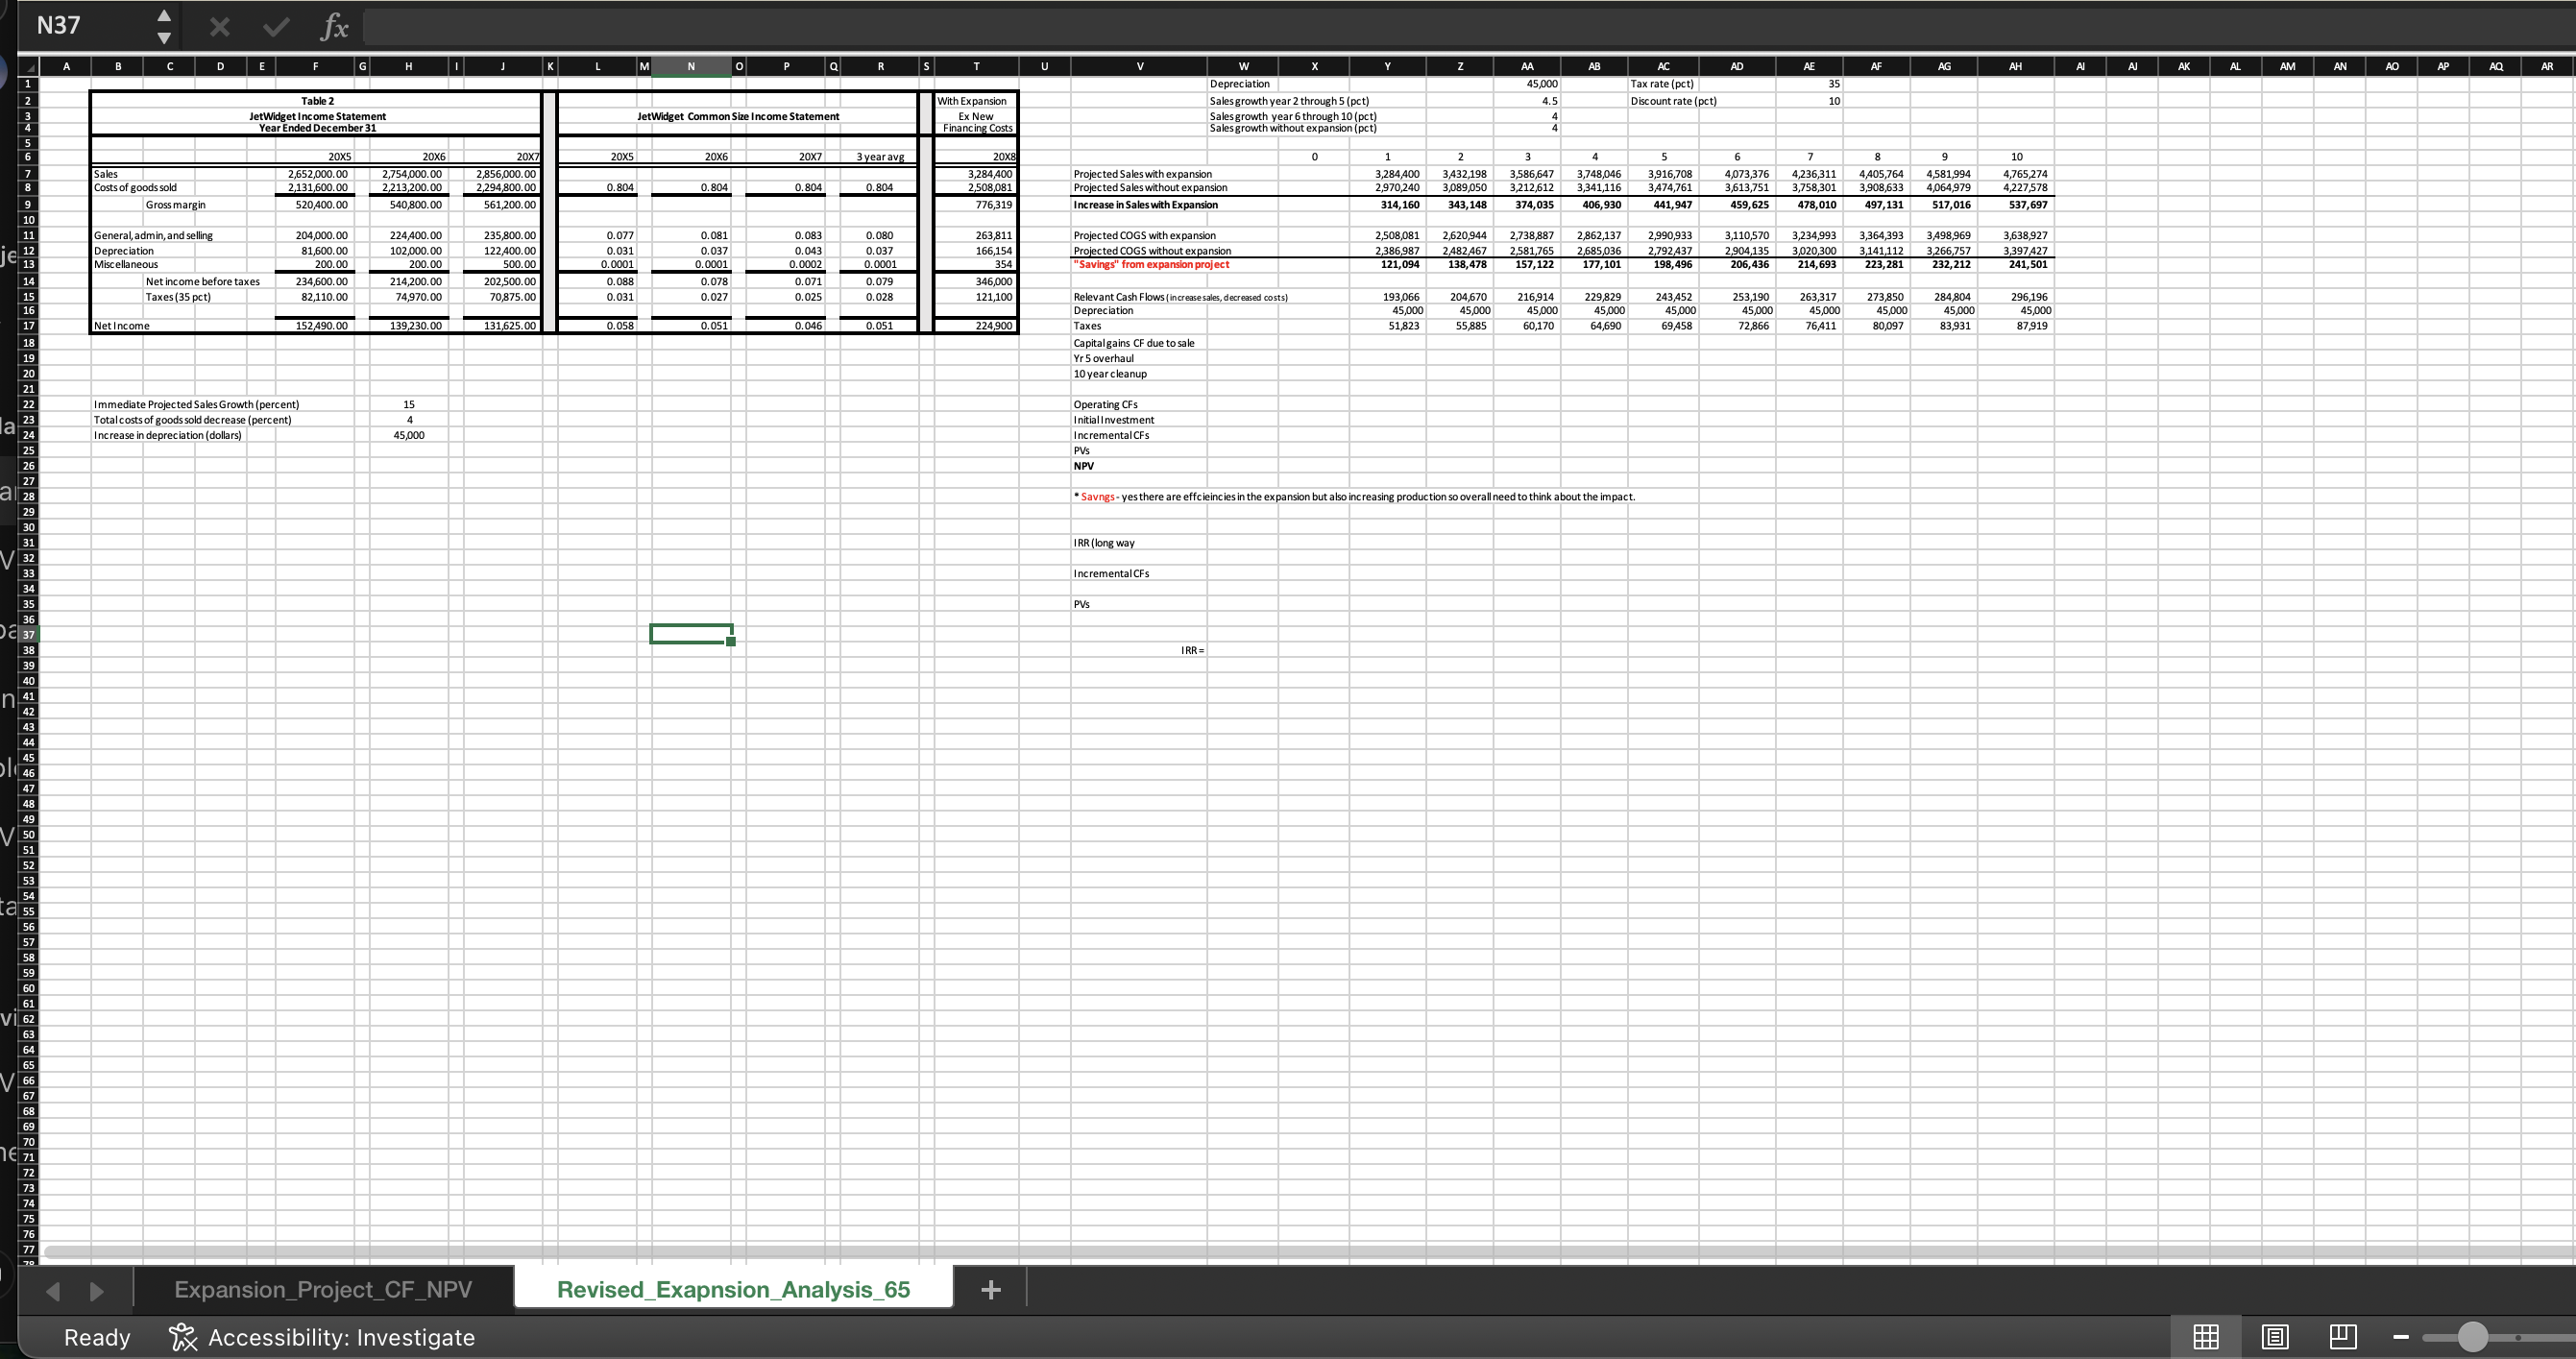
Revised Initial Cost$500,000Annual Revenuesno changeAnnual Costs (Excluding Depreciation) except for the year the overhaul is completed, costs are 0no changeYear 5 Overhaul$400,000Year 10 Clean-up Costs
$800,000
Equipment Salvage/Book Value$50,000Useful Life10 yearsr (different than previously provided)0.10Tax Rate0.35Equipment Sold For$60,000
N37 A X v fx Q W AA AC AD AG AH Depreciation 45,000 AM AN AO Table 2 Tax rate (pct) etWidget Income Statement With Expansion JetWidget Common Size Income Statement Sales growth year 2 through 5 (pct) 4.5 35 Year Ended December 31" Ex New Sales growth year 6 through 10 (pct) Discount rate (pct) 10 Financing Costs Sales growth without expansion (pct) 20X5 20X6 20X5 Sales 20X6 20X7 2,652,000.00 2,754,000.00 3 year ave ,856,000.0 5 6 Costs of goods sold 2,131,600.00 2,213,200.00 10 2,294,800.00 0.804 3,284 400 0.804 0.804 0.804 2508,081 Projected Sales with expansion 3,284,400 3,432,198 2.970,240 3,916,708 4,073,376 4,236,311 405,76 $81,994 65,274 Gross margin 520,400.00 540,800.00 561,200.00 Projected Sales without expansion 3,089,050 3,212,612 3.341,116 13,751 908,633 776,319 4,064,979 4 227 578 Increase in Sales with Expansion 314,160 343,148 374,035 406.930 41.947 459.625 478,010 497,131 517,016 537 , 697 General, admin, and selling 204,000.00 224,400.00 235,800.00 0.077 0.081 0.083 0.080 Depreciation 81,600.00 102,000.00 122,400.00 0,031 0.037 263,81 Projected COGS with expansion 2,508,081 2,620,944 0.043 Miscellaneous 0.037 2, 738,887 2,862,137 2,990,933 3,110,570 3,234,993 3,364,393 3,498,969 0.0001 0.0001 0.0001 166,154 354 Projected COGS without expansion 2482 467 2,685 036 2,792 437 3,638,927 386,987 0.0002 904,135 3,020,300 "Savings" from expansion project 138,478 157,122 3,141,112 3,266,757 3 397 427 Net income before taxes 234,600.00 214,200.00 202,500.00 21,094 177,10 198,49 0.088 0.078 206 , 436 214, 693 223,281 232,21 241, 501 Taxes (35 pct) 82,110.00 0.071 74,970.00 70,875.00 0.079 346,000 0.031 0.027 0.025 0.028 121,100 Relevant Cash Flows (increase sales, decreased costs) Depreciation 193,066 204,670 216,914 229,82 243,452 253,190 45,000 263,317 273,850 284 804 45,000 296, 196 Net Income 152 490.00 139,230.00 131,625.00 0.058 0. 051 0.046 45,000 45,000 45,000 45,000 45,000 45,000 224,900 Taxes 51,823 55 885 45,000 45,000 60170 64,690 69 458 72,866 76,411 80,097 83,931 87919 Capital gains CF due to sale r 5 overhaul 10 year cleanup Immediate Projected Sales Growth (percent) Total costs of goods sold decrease (percent) 15 Operating CFs Increase in depreciation (dollars) 45,000 Initial Investment Incremental CFs PVS NPL Savings - yes there are effciencies in the expansion but also increasing production so overall need to think about the impact. RR (long way Incremental CFs PVs IRR D Expansion_Project_CF_NPV Revised_Exapnsion_Analysis_65 + Ready Accessibility: Investigate
Step by Step Solution
There are 3 Steps involved in it
1 Expert Approved Answer
Step: 1 Unlock
Question Has Been Solved by an Expert!
Get step-by-step solutions from verified subject matter experts
Step: 2 Unlock
Step: 3 Unlock
Students Have Also Explored These Related Finance Questions!