

Question: complete the table in excel with the formulas and answer question e,f,g please and thank you! Consider the total production of ice cream in Canada
complete the table in excel with the formulas and answer question e,f,g
please and thank you!
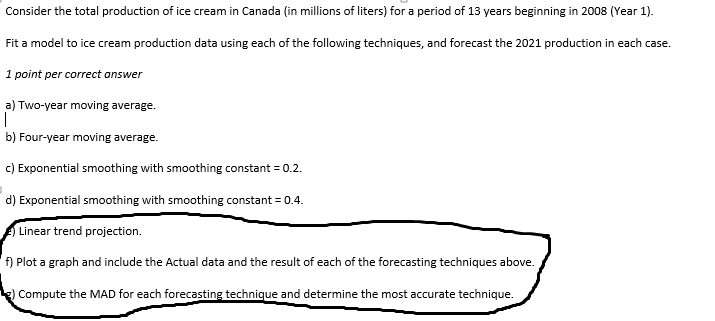
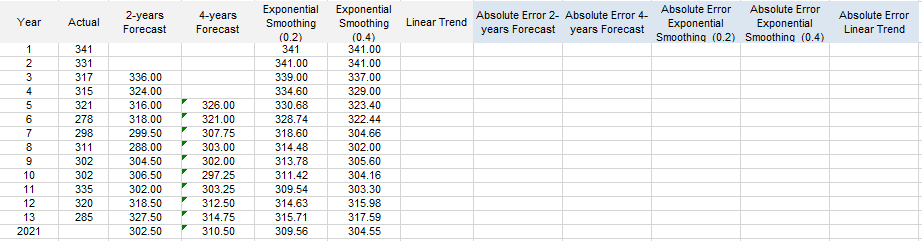
Consider the total production of ice cream in Canada (in millions of liters) for a period of 13 years beginning in 2008 (Year 1). Fit a model to ice cream production data using each of the following techniques, and forecast the 2021 production in each case. 1 point per correct answer a) Two-year moving average. 1 b) Four-year moving average. c) Exponential smoothing with smoothing constant = 0.2. d) Exponential smoothing with smoothing constant = 0.4. Linear trend projection. f) Plot a graph and include the Actual data and the result of each of the forecasting techniques above. Compute the MAD for each forecasting technique and determine the most accurate technique. Year Actual 2-years Forecast 4-years Forecast Linear Trend Absolute Error 2- Absolute Error 4- years Forecast years Forecast Absolute Error Absolute Error Exponential Exponential Smoothing (0.2) Smoothing (0.4) Absolute Error Linear Trend 1 2 3 4 5 6 7 8 9 10 11 12 13 2021 341 331 317 315 321 278 298 311 302 302 335 320 285 336.00 324.00 316.00 318.00 299.50 288.00 304.50 306.50 302.00 318.50 327.50 302.50 326.00 321.00 307.75 303.00 302.00 297.25 303.25 312.50 314.75 310.50 Exponential Smoothing (0.2) 341 341.00 339.00 334.60 330.68 328.74 318.60 314.48 313.78 311.42 309.54 314.63 315.71 309.56 Exponential Smoothing (0.4) 341.00 341.00 337.00 329.00 323.40 322.44 304.66 302.00 305.60 304.16 303.30 315.98 317.59 304.55Step by Step Solution
There are 3 Steps involved in it
1 Expert Approved Answer
Step: 1 Unlock

Question Has Been Solved by an Expert!
Get step-by-step solutions from verified subject matter experts
Step: 2 Unlock
Step: 3 Unlock