

Question: PLEASE SHOW EXCEL FORMULAS! A B D E F G H J K L 1 2 3 4 5 International Machines & Software Inc.'s Investment
 PLEASE SHOW EXCEL FORMULAS!
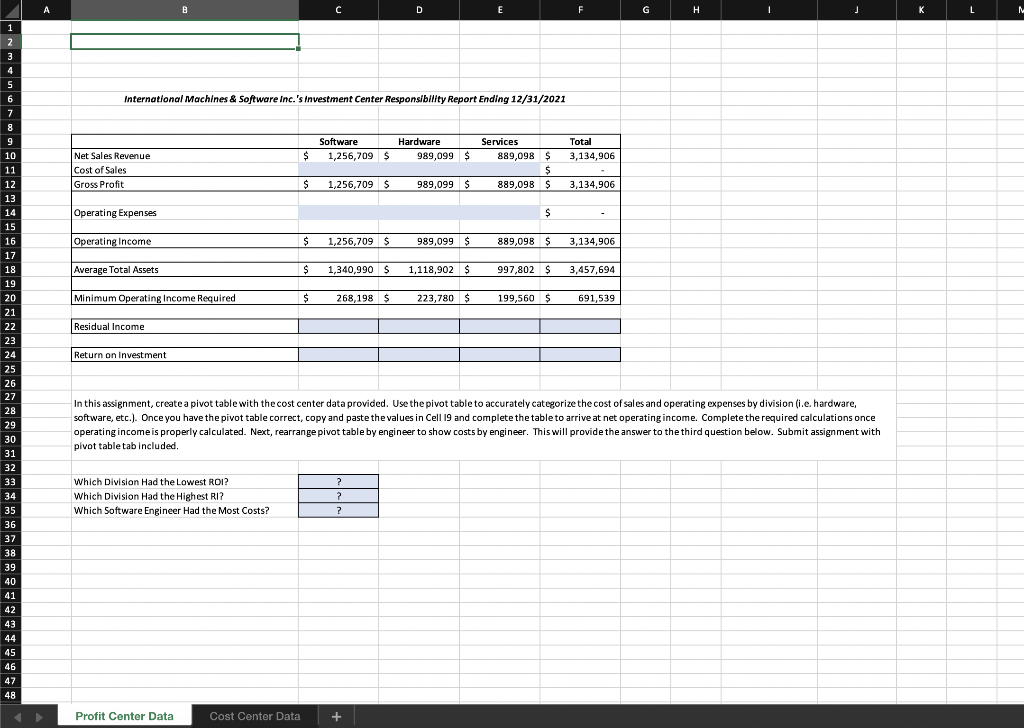
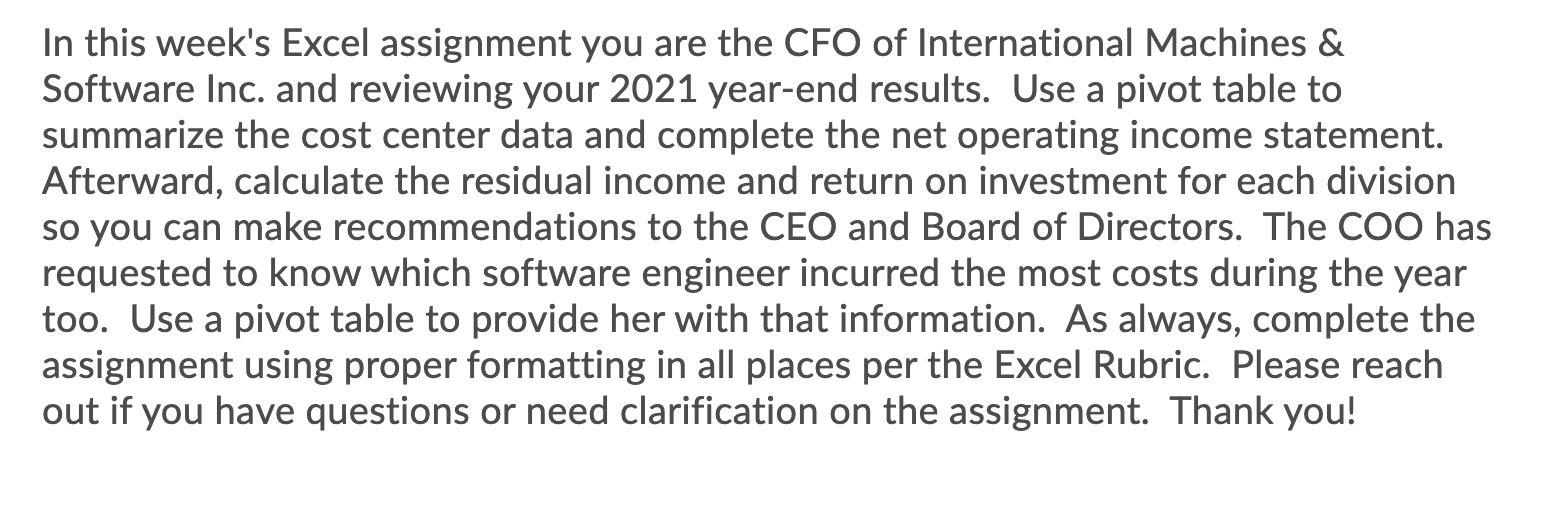
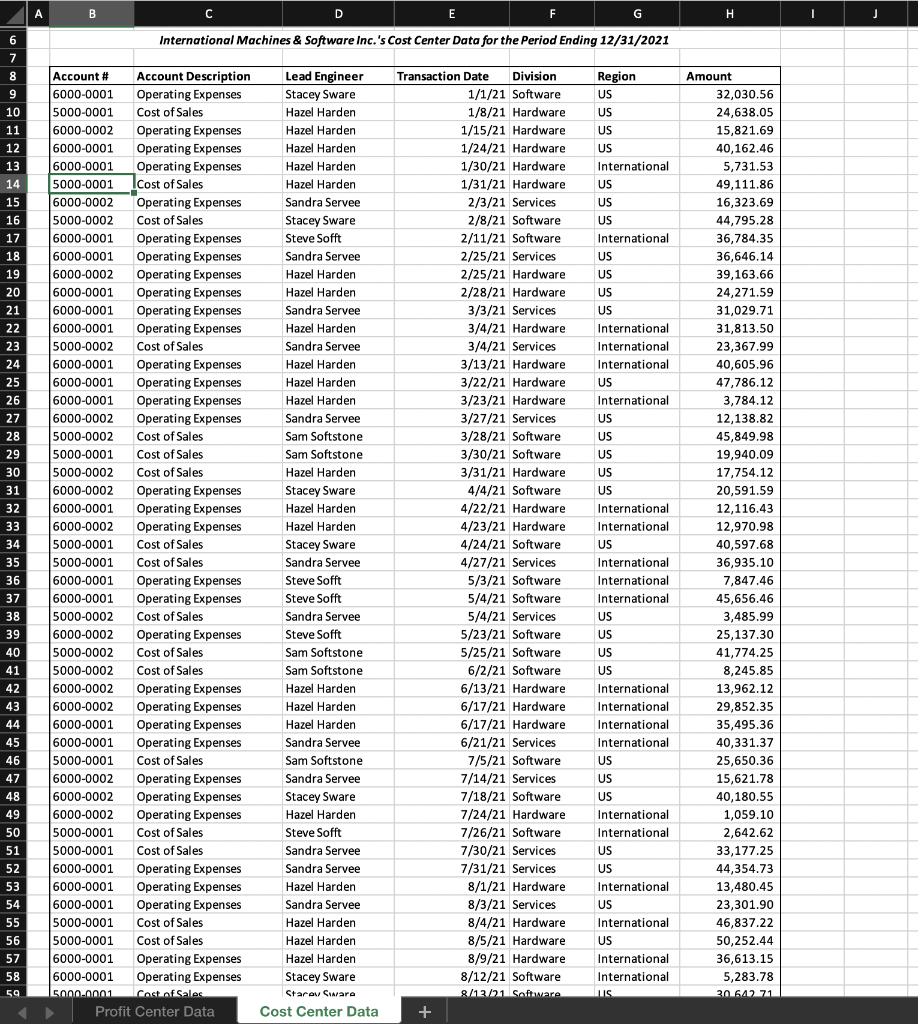
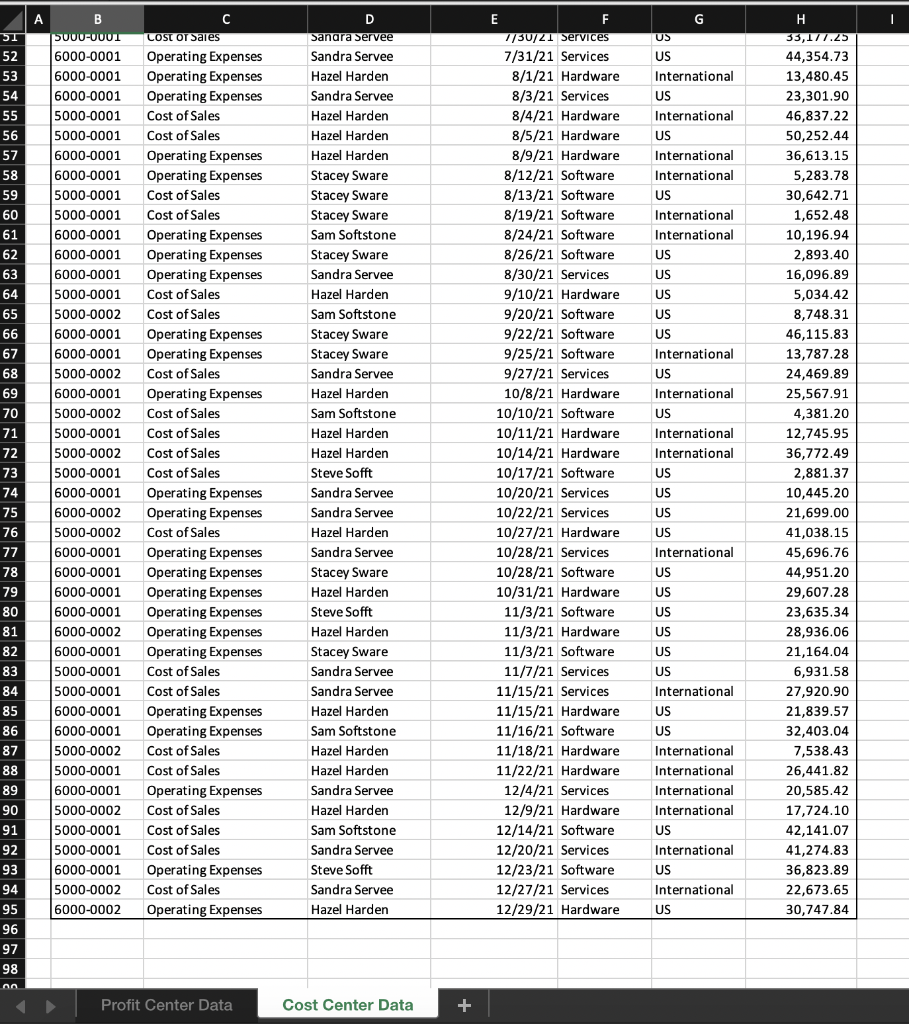
A B D E F G H J K L 1 2 3 4 5 International Machines & Software Inc.'s Investment Center Responsibility Report Ending 12/31/2021 Software 1,256,709 $ Hardware 989,099 $ $ Total 3,134,906 Net Sales Revenue Cost of Sales Gross Profit Services 889,098 $ $ 889,098 $ $ 1,256,709 $ 989,099 $ 3,134,906 Operating Expenses $ Operating Income $ 1,256,709 $ 989,099 $ $ 889,098 $ 3,134,906 Average Total Assets $ 1,340,990 1,118,902 $ 997,802 3,457,694 6 7 7 8 9 9 10 11 12 13 14 15 16 17 18 19 20 21 22 23 24 25 26 27 28 29 30 31 32 33 Minimum Operating Income Required $ $ 268,198 $ 223,780 $ 199,560 $ 691,539 Residual Income Return on Investment In this assignment, create a pivot table with the cost center data provided. Use the pivot table to accurately categorize the cost of sales and operating expenses by division (i.e. hardware, software, etc.). Once you have the pivot table correct, copy and paste the values in Cell 19 and complete the table to arrive at net operating income. Complete the required calculations once operating income is properly calculated. Next, rearrange pivot table by engineer to show costs by engineer. This will provide the answer to the third question below. Submit assignment with pivot table tab included. Which Division Had the Lowest ROI? Which Division Had the Highest RI? Which Software Engineer Had the Most Costs? ? 2 34 ? 35 36 37 38 39 40 41 42 43 44 45 46 47 48 Profit Center Data Cost Center Data + In this week's Excel assignment you are the CFO of International Machines & Software Inc. and reviewing your 2021 year-end results. Use a pivot table to summarize the cost center data and complete the net operating income statement. Afterward, calculate the residual income and return on investment for each division so you can make recommendations to the CEO and Board of Directors. The COO has requested to know which software engineer incurred the most costs during the year too. Use a pivot table to provide her with that information. As always, complete the assignment using proper formatting in all places per the Excel Rubric. Please reach out if you have questions or need clarification on the assignment. Thank you! A B H I J D E F G International Machines & Software Inc.'s Cost Center Data for the Period Ending 12/31/2021 6 7 8 9 10 11 12 13 14 15 Region US US US US International US 16 17 18 19 20 21 22 23 24 25 26 27 28 29 30 31 32 33 34 Account # Account Description 6000-0001 Operating Expenses 5000-0001 Cost of Sales 6000-0002 Operating Expenses 6000-0001 Operating Expenses 6000-0001 Operating Expenses 5000-0001 Icost of Sales 6000-0002 Operating Expenses 5000-0002 Cost of Sales 6000-0001 Operating Expenses 6000-0001 Operating Expenses 6000-0002 Operating Expenses 6000-0001 Operating Expenses 6000-0001 Operating Expenses 6000-0001 Operating Expenses 5000-0002 Cost of Sales 6000-0001 Operating Expenses 6000-0001 Operating Expenses 6000-0001 Operating Expenses 6000-0002 Operating Expenses 5000-0002 Cost of Sales 5000-0001 Cost of Sales 5000-0002 Cost of Sales 6000-0002 Operating Expenses 6000-0001 Operating Expenses 6000-0002 Operating Expenses 5000-0001 Cost of Sales 5000-0001 Cost of Sales 6000-0001 Operating Expenses 6000-0001 Operating Expenses 5000-0002 Cost of Sales 6000-0002 Operating Expenses 5000-0002 Cost of Sales 5000-0002 Cost of Sales 6000-0002 Operating Expenses 6000-0002 Operating Expenses 6000-0001 Operating Expenses 6000-0001 Operating Expenses 5000-0001 Cost of Sales 6000-0002 Operating Expenses 6000-0002 Operating Expenses 6000-0002 Operating Expenses 5000-0001 Cost of Sales 5000-0001 Cost of Sales 6000-0001 Operating Expenses 6000-0001 Operating Expenses 6000-0001 Operating Expenses 5000-0001 Cost of Sales 5000-0001 Cost of Sales 6000-0001 Operating Expenses 6000-0001 Operating Expenses 5000-0001 Cost of Sales Profit Center Data Lead Engineer Stacey Sware Hazel Harden Hazel Harden Hazel Harden Hazel Harden Hazel Harden Sandra Servee Stacey Sware Steve Sofft Sandra Servee Hazel Harden Hazel Harden Sandra Servee Hazel Harden Sandra Servee Hazel Harden Hazel Harden Hazel Harden Sandra Servee Sam Softstone Sam Softstone Hazel Harden Stacey Sware Hazel Harden Hazel Harden Stacey Sware Sandra Servee Steve Sofft Steve Sofft Sandra Servee Steve Sofft Sam Softstone Sam Softstone Hazel Harden Hazel Harden Hazel Harden Sandra Servee Sam Softstone Sandra Servee Stacey Sware Hazel Harden Steve Sofft Sandra Servee Sandra Servee Hazel Harden Sandra Servee Hazel Harden Hazel Harden Hazel Harden Stacey Sware Stare Curare Cost Center Data Transaction Date Division 1/1/21 Software 1/8/21 Hardware 1/15/21 Hardware 1/24/21 Hardware 1/30/21 Hardware 1/31/21 Hardware 2/3/21 Services 2/8/21 Software 2/11/21 Software 2/25/21 Services 2/25/21 Hardware 2/28/21 Hardware 3/3/21 Services 3/4/21 Hardware 3/4/21 Services 3/13/21 Hardware 3/22/21 Hardware 3/23/21 Hardware 3/27/21 Services 3/28/21 Software 3/30/21 Software 3/31/21 Hardware 4/4/21 Software 4/22/21 Hardware 4/23/21 Hardware 4/24/21 Software 4/27/21 Services 5/3/21 Software 5/4/21 Software 5/4/21 Services 5/23/21 Software 5/25/21 Software 6/2/21 Software 6/13/21 Hardware 6/17/21 Hardware 6/17/21 Hardware 6/21/21 Services 7/5/21 Software 7/14/21 Services 7/18/21 Software 7/24/21 Hardware 7/26/21 Software 7/30/21 Services 7/31/21 Services 8/1/21 Hardware 8/3/21 Services 8/4/21 Hardware 8/5/21 Hardware 8/9/21 Hardware 8/12/21 Software 8/12/21 Software + Amount 32,030.56 24,638.05 15,821.69 40,162.46 5,731.53 49,111.86 16,323.69 44,795.28 36,784.35 36,646.14 39,163.66 24,271.59 31,029.71 31,813.50 23,367.99 40,605.96 47,786.12 3,784.12 12,138.82 45,849.98 19,940.09 17,754.12 20,591.59 12,116.43 12,970.98 40,597.68 36,935.10 7,847.46 45,656.46 3,485.99 25,137.30 41,774.25 8,245.85 13,962.12 29,852.35 35,495.36 40,331.37 25,650.36 15,621.78 40,180.55 1,059.10 2,642.62 33,177.25 44,354.73 13,480.45 23,301.90 46,837.22 50,252.44 36,613.15 5,283.78 30.642 71 US US International US US US US International International International US International US US US US US International International US International International International US US US US International International International International US US US International International US US International US International US International International LIS 35 36 37 38 39 40 41 42 43 44 45 46 47 48 49 50 51 52 53 54 55 56 57 58 59 G I. US US International US International US International International US International International US US US 51 52 53 54 55 56 57 58 59 60 61 62 63 64 65 66 67 68 69 70 71 72 73 74 75 76 77 78 79 80 81 82 83 84 85 86 87 88 89 90 91 92 93 94 95 96 97 98 A B DU0U-UUT 6000-0001 6000-0001 6000-0001 5000-0001 5000-0001 6000-0001 6000-0001 5000-0001 5000-0001 6000-0001 6000-0001 6000-0001 5000-0001 5000-0002 6000-0001 6000-0001 5000-0002 6000-0001 5000-0002 5000-0001 5000-0002 5000-0001 6000-0001 6000-0002 5000-0002 6000-0001 6000-0001 6000-0001 6000-0001 6000-0002 6000-0001 5000-0001 5000-0001 6000-0001 6000-0001 5000-0002 5000-0001 6000-0001 5000-0002 5000-0001 5000-0001 6000-0001 5000-0002 6000-0002 COST OT Sales Operating Expenses Operating Expenses Operating Expenses Cost of Sales Cost of Sales Operating Expenses Operating Expenses Cost of Sales Cost of Sales Operating Expenses Operating Expenses Operating Expenses Cost of Sales Cost of Sales Operating Expenses Operating Expenses Cost of Sales Operating Expenses Cost of Sales Cost of Sales Cost of Sales Cost of Sales Operating Expenses Operating Expenses Cost of Sales Operating Expenses Operating Expenses Operating Expenses Operating Expenses Operating Expenses Operating Expenses Cost of Sales Cost of Sales Operating Expenses Operating Expenses Cost of Sales Cost of Sales Operating Expenses Cost of Sales Cost of Sales Cost of Sales Operating Expenses Cost of Sales Operating Expenses D Sanara servee Sandra Servee Hazel Harden Sandra Servee Hazel Harden Hazel Harden Hazel Harden Stacey Sware Stacey Sware Stacey Sware Sam Softstone Stacey Sware Sandra Servee Hazel Harden Sam Softstone Stacey Sware Stacey Sware Sandra Servee Hazel Harden Sam Softstone Hazel Harden Hazel Harden Steve Sofft Sandra Servee Sandra Servee Hazel Harden Sandra Servee Stacey Sware Hazel Harden Steve Sofft Hazel Harden Stacey Sware Sandra Servee Sandra Servee Hazel Harden Sam Softstone Hazel Harden Hazel Harden Sandra Servee Hazel Harden Sam Softstone Sandra Servee Steve Sofft Sandra Servee Hazel Harden E 1/30721 Services 7/31/21 Services 8/1/21 Hardware 8/3/21 Services 8/4/21 Hardware 8/5/21 Hardware 8/9/21 Hardware 8/12/21 Software 8/13/21 Software 8/19/21 Software 8/24/21 Software 8/26/21 Software 8/30/21 Services 9/10/21 Hardware 9/20/21 Software 9/22/21 Software 9/25/21 Software 9/27/21 Services 10/8/21 Hardware 10/10/21 Software 10/11/21 Hardware 10/14/21 Hardware 10/17/21 Software 10/20/21 Services 10/22/21 Services 10/27/21 Hardware 10/28/21 Services 10/28/21 Software 10/31/21 Hardware 11/3/21 Software 11/3/21 Hardware 11/3/21 Software 11/7/21 Services 11/15/21 Services 11/15/21 Hardware 11/16/21 Software 11/18/21 Hardware 11/22/21 Hardware 12/4/21 Services 12/9/21 Hardware 12/14/21 Software 12/20/21 Services 12/23/21 Software 12/27/21 Services 12/29/21 Hardware US US International US International US International International US US US US International US US US US H 33,177.25 44,354.73 13,480.45 23,301.90 46,837.22 50,252.44 36,613.15 5,283.78 30,642.71 1,652.48 10,196.94 2,893.40 16,096.89 5,034.42 8,748.31 46,115.83 13,787.28 24,469.89 25,567.91 4,381.20 12,745.95 36,772.49 2,881.37 10,445.20 21,699.00 41,038.15 45,696.76 44,951.20 29,607.28 23,635.34 28,936.06 21,164.04 6,931.58 27,920.90 21,839.57 32,403.04 7,538.43 26,441.82 20,585.42 17,724.10 42,141.07 41,274.83 36,823.89 22,673.65 30,747.84 US US International US US International International International International US International US International US Profit Center Data Cost Center Data + A B D E F G H J K L 1 2 3 4 5 International Machines & Software Inc.'s Investment Center Responsibility Report Ending 12/31/2021 Software 1,256,709 $ Hardware 989,099 $ $ Total 3,134,906 Net Sales Revenue Cost of Sales Gross Profit Services 889,098 $ $ 889,098 $ $ 1,256,709 $ 989,099 $ 3,134,906 Operating Expenses $ Operating Income $ 1,256,709 $ 989,099 $ $ 889,098 $ 3,134,906 Average Total Assets $ 1,340,990 1,118,902 $ 997,802 3,457,694 6 7 7 8 9 9 10 11 12 13 14 15 16 17 18 19 20 21 22 23 24 25 26 27 28 29 30 31 32 33 Minimum Operating Income Required $ $ 268,198 $ 223,780 $ 199,560 $ 691,539 Residual Income Return on Investment In this assignment, create a pivot table with the cost center data provided. Use the pivot table to accurately categorize the cost of sales and operating expenses by division (i.e. hardware, software, etc.). Once you have the pivot table correct, copy and paste the values in Cell 19 and complete the table to arrive at net operating income. Complete the required calculations once operating income is properly calculated. Next, rearrange pivot table by engineer to show costs by engineer. This will provide the answer to the third question below. Submit assignment with pivot table tab included. Which Division Had the Lowest ROI? Which Division Had the Highest RI? Which Software Engineer Had the Most Costs? ? 2 34 ? 35 36 37 38 39 40 41 42 43 44 45 46 47 48 Profit Center Data Cost Center Data + In this week's Excel assignment you are the CFO of International Machines & Software Inc. and reviewing your 2021 year-end results. Use a pivot table to summarize the cost center data and complete the net operating income statement. Afterward, calculate the residual income and return on investment for each division so you can make recommendations to the CEO and Board of Directors. The COO has requested to know which software engineer incurred the most costs during the year too. Use a pivot table to provide her with that information. As always, complete the assignment using proper formatting in all places per the Excel Rubric. Please reach out if you have questions or need clarification on the assignment. Thank you! A B H I J D E F G International Machines & Software Inc.'s Cost Center Data for the Period Ending 12/31/2021 6 7 8 9 10 11 12 13 14 15 Region US US US US International US 16 17 18 19 20 21 22 23 24 25 26 27 28 29 30 31 32 33 34 Account # Account Description 6000-0001 Operating Expenses 5000-0001 Cost of Sales 6000-0002 Operating Expenses 6000-0001 Operating Expenses 6000-0001 Operating Expenses 5000-0001 Icost of Sales 6000-0002 Operating Expenses 5000-0002 Cost of Sales 6000-0001 Operating Expenses 6000-0001 Operating Expenses 6000-0002 Operating Expenses 6000-0001 Operating Expenses 6000-0001 Operating Expenses 6000-0001 Operating Expenses 5000-0002 Cost of Sales 6000-0001 Operating Expenses 6000-0001 Operating Expenses 6000-0001 Operating Expenses 6000-0002 Operating Expenses 5000-0002 Cost of Sales 5000-0001 Cost of Sales 5000-0002 Cost of Sales 6000-0002 Operating Expenses 6000-0001 Operating Expenses 6000-0002 Operating Expenses 5000-0001 Cost of Sales 5000-0001 Cost of Sales 6000-0001 Operating Expenses 6000-0001 Operating Expenses 5000-0002 Cost of Sales 6000-0002 Operating Expenses 5000-0002 Cost of Sales 5000-0002 Cost of Sales 6000-0002 Operating Expenses 6000-0002 Operating Expenses 6000-0001 Operating Expenses 6000-0001 Operating Expenses 5000-0001 Cost of Sales 6000-0002 Operating Expenses 6000-0002 Operating Expenses 6000-0002 Operating Expenses 5000-0001 Cost of Sales 5000-0001 Cost of Sales 6000-0001 Operating Expenses 6000-0001 Operating Expenses 6000-0001 Operating Expenses 5000-0001 Cost of Sales 5000-0001 Cost of Sales 6000-0001 Operating Expenses 6000-0001 Operating Expenses 5000-0001 Cost of Sales Profit Center Data Lead Engineer Stacey Sware Hazel Harden Hazel Harden Hazel Harden Hazel Harden Hazel Harden Sandra Servee Stacey Sware Steve Sofft Sandra Servee Hazel Harden Hazel Harden Sandra Servee Hazel Harden Sandra Servee Hazel Harden Hazel Harden Hazel Harden Sandra Servee Sam Softstone Sam Softstone Hazel Harden Stacey Sware Hazel Harden Hazel Harden Stacey Sware Sandra Servee Steve Sofft Steve Sofft Sandra Servee Steve Sofft Sam Softstone Sam Softstone Hazel Harden Hazel Harden Hazel Harden Sandra Servee Sam Softstone Sandra Servee Stacey Sware Hazel Harden Steve Sofft Sandra Servee Sandra Servee Hazel Harden Sandra Servee Hazel Harden Hazel Harden Hazel Harden Stacey Sware Stare Curare Cost Center Data Transaction Date Division 1/1/21 Software 1/8/21 Hardware 1/15/21 Hardware 1/24/21 Hardware 1/30/21 Hardware 1/31/21 Hardware 2/3/21 Services 2/8/21 Software 2/11/21 Software 2/25/21 Services 2/25/21 Hardware 2/28/21 Hardware 3/3/21 Services 3/4/21 Hardware 3/4/21 Services 3/13/21 Hardware 3/22/21 Hardware 3/23/21 Hardware 3/27/21 Services 3/28/21 Software 3/30/21 Software 3/31/21 Hardware 4/4/21 Software 4/22/21 Hardware 4/23/21 Hardware 4/24/21 Software 4/27/21 Services 5/3/21 Software 5/4/21 Software 5/4/21 Services 5/23/21 Software 5/25/21 Software 6/2/21 Software 6/13/21 Hardware 6/17/21 Hardware 6/17/21 Hardware 6/21/21 Services 7/5/21 Software 7/14/21 Services 7/18/21 Software 7/24/21 Hardware 7/26/21 Software 7/30/21 Services 7/31/21 Services 8/1/21 Hardware 8/3/21 Services 8/4/21 Hardware 8/5/21 Hardware 8/9/21 Hardware 8/12/21 Software 8/12/21 Software + Amount 32,030.56 24,638.05 15,821.69 40,162.46 5,731.53 49,111.86 16,323.69 44,795.28 36,784.35 36,646.14 39,163.66 24,271.59 31,029.71 31,813.50 23,367.99 40,605.96 47,786.12 3,784.12 12,138.82 45,849.98 19,940.09 17,754.12 20,591.59 12,116.43 12,970.98 40,597.68 36,935.10 7,847.46 45,656.46 3,485.99 25,137.30 41,774.25 8,245.85 13,962.12 29,852.35 35,495.36 40,331.37 25,650.36 15,621.78 40,180.55 1,059.10 2,642.62 33,177.25 44,354.73 13,480.45 23,301.90 46,837.22 50,252.44 36,613.15 5,283.78 30.642 71 US US International US US US US International International International US International US US US US US International International US International International International US US US US International International International International US US US International International US US International US International US International International LIS 35 36 37 38 39 40 41 42 43 44 45 46 47 48 49 50 51 52 53 54 55 56 57 58 59 G I. US US International US International US International International US International International US US US 51 52 53 54 55 56 57 58 59 60 61 62 63 64 65 66 67 68 69 70 71 72 73 74 75 76 77 78 79 80 81 82 83 84 85 86 87 88 89 90 91 92 93 94 95 96 97 98 A B DU0U-UUT 6000-0001 6000-0001 6000-0001 5000-0001 5000-0001 6000-0001 6000-0001 5000-0001 5000-0001 6000-0001 6000-0001 6000-0001 5000-0001 5000-0002 6000-0001 6000-0001 5000-0002 6000-0001 5000-0002 5000-0001 5000-0002 5000-0001 6000-0001 6000-0002 5000-0002 6000-0001 6000-0001 6000-0001 6000-0001 6000-0002 6000-0001 5000-0001 5000-0001 6000-0001 6000-0001 5000-0002 5000-0001 6000-0001 5000-0002 5000-0001 5000-0001 6000-0001 5000-0002 6000-0002 COST OT Sales Operating Expenses Operating Expenses Operating Expenses Cost of Sales Cost of Sales Operating Expenses Operating Expenses Cost of Sales Cost of Sales Operating Expenses Operating Expenses Operating Expenses Cost of Sales Cost of Sales Operating Expenses Operating Expenses Cost of Sales Operating Expenses Cost of Sales Cost of Sales Cost of Sales Cost of Sales Operating Expenses Operating Expenses Cost of Sales Operating Expenses Operating Expenses Operating Expenses Operating Expenses Operating Expenses Operating Expenses Cost of Sales Cost of Sales Operating Expenses Operating Expenses Cost of Sales Cost of Sales Operating Expenses Cost of Sales Cost of Sales Cost of Sales Operating Expenses Cost of Sales Operating Expenses D Sanara servee Sandra Servee Hazel Harden Sandra Servee Hazel Harden Hazel Harden Hazel Harden Stacey Sware Stacey Sware Stacey Sware Sam Softstone Stacey Sware Sandra Servee Hazel Harden Sam Softstone Stacey Sware Stacey Sware Sandra Servee Hazel Harden Sam Softstone Hazel Harden Hazel Harden Steve Sofft Sandra Servee Sandra Servee Hazel Harden Sandra Servee Stacey Sware Hazel Harden Steve Sofft Hazel Harden Stacey Sware Sandra Servee Sandra Servee Hazel Harden Sam Softstone Hazel Harden Hazel Harden Sandra Servee Hazel Harden Sam Softstone Sandra Servee Steve Sofft Sandra Servee Hazel Harden E 1/30721 Services 7/31/21 Services 8/1/21 Hardware 8/3/21 Services 8/4/21 Hardware 8/5/21 Hardware 8/9/21 Hardware 8/12/21 Software 8/13/21 Software 8/19/21 Software 8/24/21 Software 8/26/21 Software 8/30/21 Services 9/10/21 Hardware 9/20/21 Software 9/22/21 Software 9/25/21 Software 9/27/21 Services 10/8/21 Hardware 10/10/21 Software 10/11/21 Hardware 10/14/21 Hardware 10/17/21 Software 10/20/21 Services 10/22/21 Services 10/27/21 Hardware 10/28/21 Services 10/28/21 Software 10/31/21 Hardware 11/3/21 Software 11/3/21 Hardware 11/3/21 Software 11/7/21 Services 11/15/21 Services 11/15/21 Hardware 11/16/21 Software 11/18/21 Hardware 11/22/21 Hardware 12/4/21 Services 12/9/21 Hardware 12/14/21 Software 12/20/21 Services 12/23/21 Software 12/27/21 Services 12/29/21 Hardware US US International US International US International International US US US US International US US US US H 33,177.25 44,354.73 13,480.45 23,301.90 46,837.22 50,252.44 36,613.15 5,283.78 30,642.71 1,652.48 10,196.94 2,893.40 16,096.89 5,034.42 8,748.31 46,115.83 13,787.28 24,469.89 25,567.91 4,381.20 12,745.95 36,772.49 2,881.37 10,445.20 21,699.00 41,038.15 45,696.76 44,951.20 29,607.28 23,635.34 28,936.06 21,164.04 6,931.58 27,920.90 21,839.57 32,403.04 7,538.43 26,441.82 20,585.42 17,724.10 42,141.07 41,274.83 36,823.89 22,673.65 30,747.84 US US International US US International International International International US International US International US Profit Center Data Cost Center Data +
Step by Step Solution
There are 3 Steps involved in it

Get step-by-step solutions from verified subject matter experts