

Question: Complete the table, starting with the lowest class limit. Use the minimum data entry as the lower limit of the first class. ?(Type integers or
Complete the table, starting with the lowest class limit. Use the minimum data entry as the lower limit of the first class. ?(Type integers or decimals. Round the class limits to the nearest whole number. Round all other values to the nearest thousandth as? needed.) Which class has the greatest? frequency? The class with the greatest frequency is from Which class has the least? frequency? The class with the least frequency is from


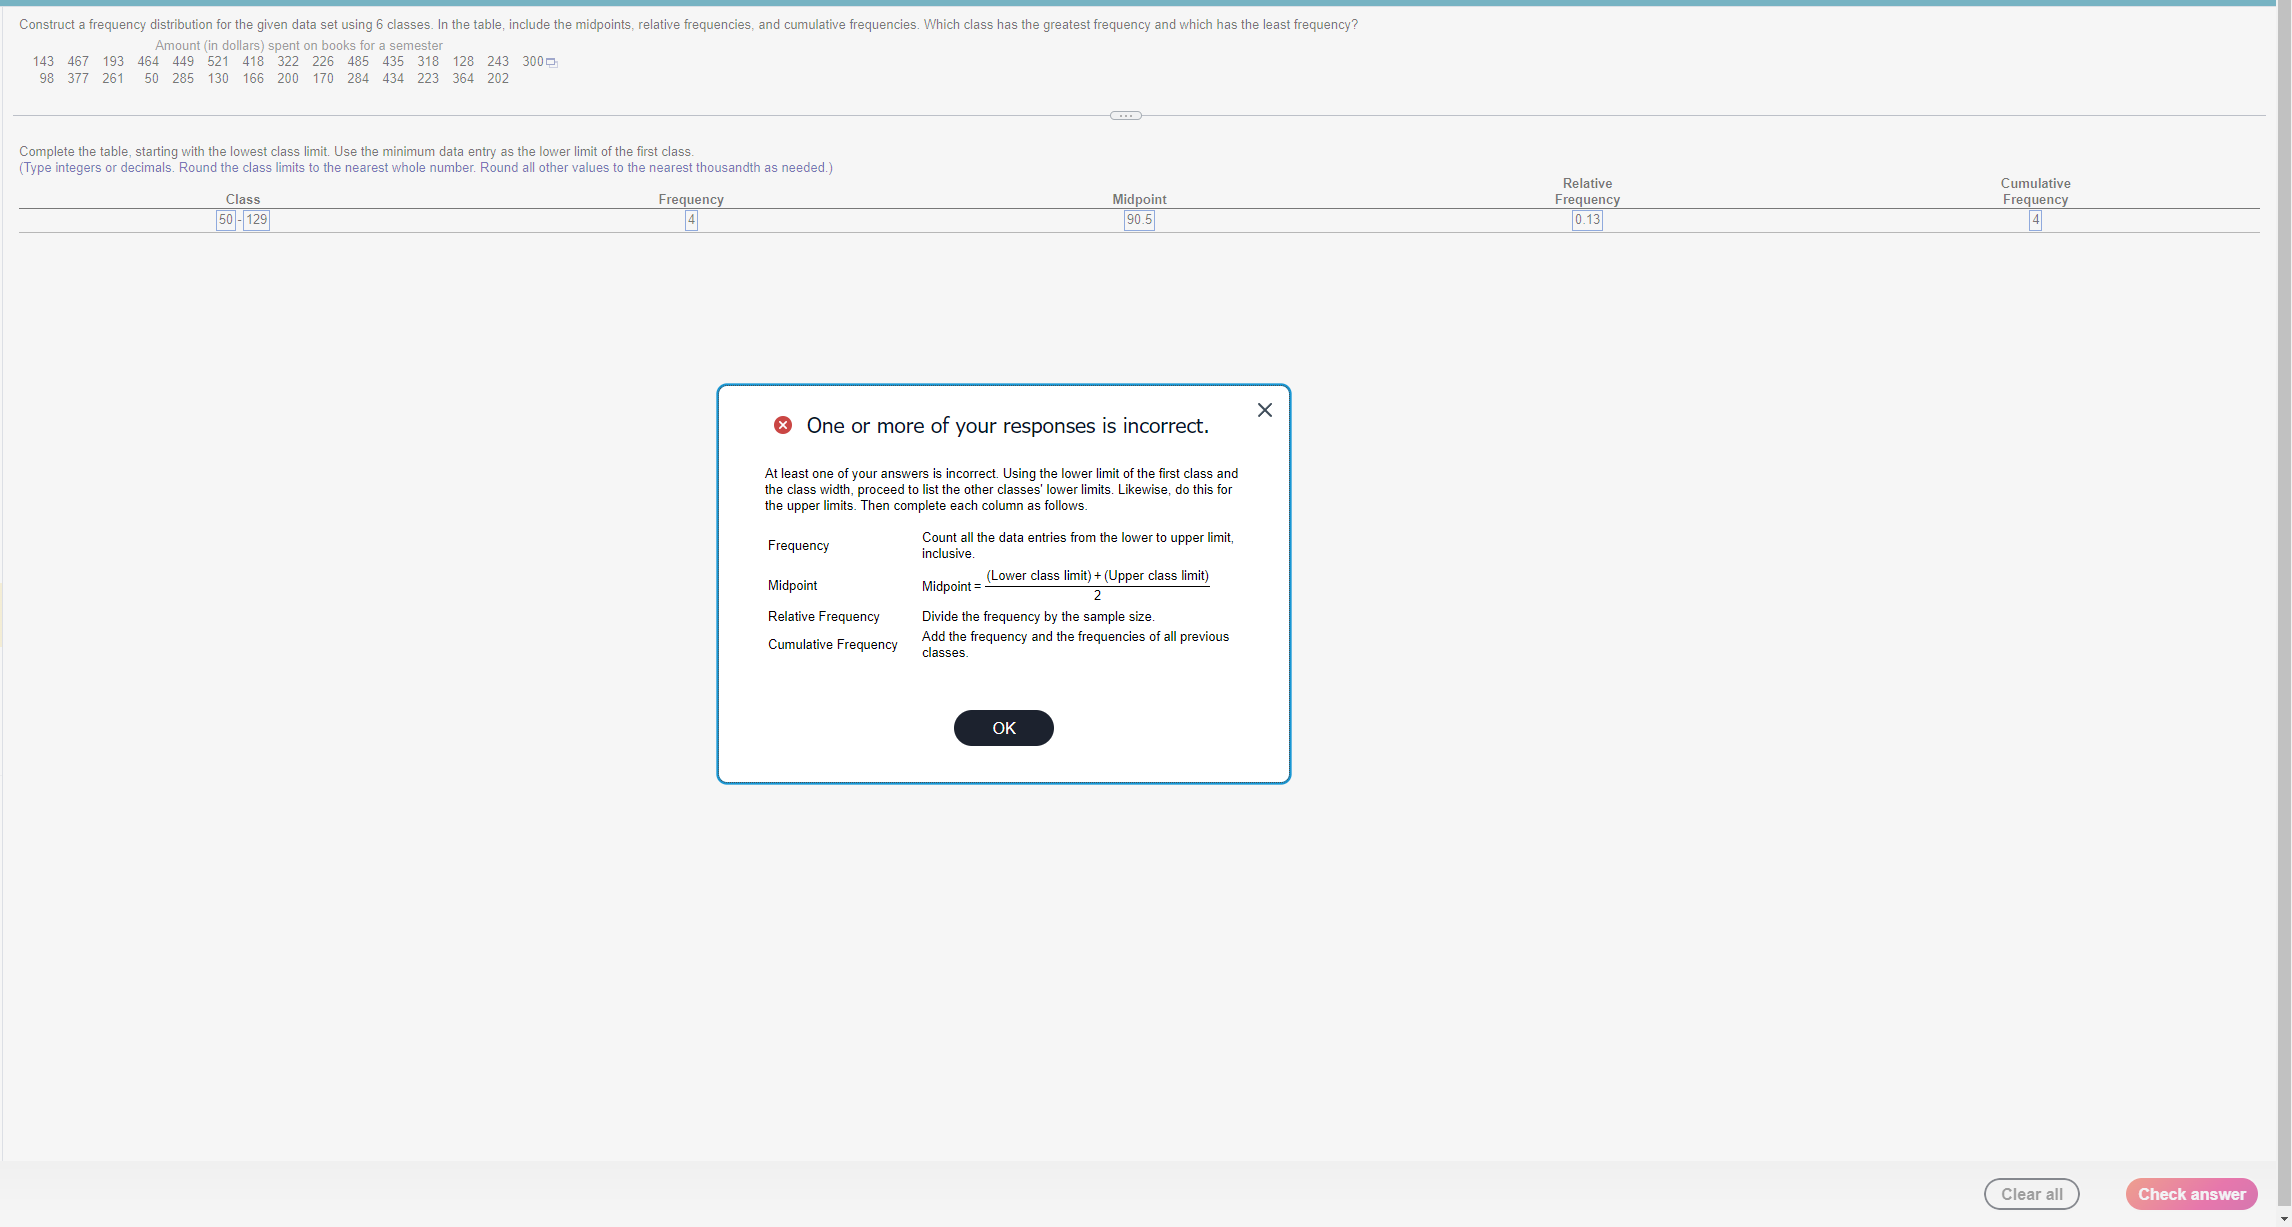
Construct a frequency distribution for the given data set using 6 classes. In the table, include the midpoints, relative frequencies, and cumulative frequencies. Which class has the greatest frequency and which has the least frequency? Amount (in dollars) spent on books for a semester 143 467 193 464 449 521 418 322 226 485 435 318 128 243 300 98 377 261 50 285 130 166 200 170 284 434 223 3 364 202Complete the table, starting with the lowest class limit. Use the minimum data entry as the lower limit of the first class. (Type integers or decimals. Round the class limits to the nearest whole number. Round all other values to the nearest thousandth as needed.) Relative Cumulative Class Frequency Midpoint Frequency FrequencyConstruct a frequency distribution for the given data set using 6 classes. In the table, include the midpoints, relative frequencies, and cumulative frequencies. Which class has the greatest frequency and which has the least frequency? Amount (in dollars) spent on books for a semester 143 467 193 464 449 521 418 322 226 485 435 318 128 243 300 98 377 261 50 285 130 166 200 170 284 434 223 364 202 Complete the table, starting with the lowest class limit. Use the minimum data entry as the lower limit of the first class. (Type integers or decimals. Round the class limits to the nearest whole number. Round all other values to the nearest thousandth as needed.) Relative Cumulative Class Frequency Midpoint Frequency Frequency 50 - 129 4 90.5 0.13 4 X One or more of your responses is incorrect. At least one of your answers is incorrect. Using the lower limit of the first class and the class width, proceed to list the other classes' lower limits. Likewise, do this for the upper limits. Then complete each column as follows. Frequency Count all the data entries from the lower to upper limit, inclusive. Midpoint Midpoint = (Lower class limit) + (Upper class limit) Relative Frequency Divide the frequency by the sample size Cumulative Frequency Add the frequency and the frequencies of all previous classes. OK Clear all Check
Step by Step Solution
There are 3 Steps involved in it

Get step-by-step solutions from verified subject matter experts