

Question: Table 5 shows the data for complaint against Cab driver . a) Based on the given data in Table 5 , calculate the Centre Line
Table 5 shows the data for complaint against Cab driver .
a) Based on the given data in Table 5 , calculate the Centre Line ( CL ) , Upper Control Limit ( UCL ) and Lower Control Limit ( LCL ) for c - chart .
b)Construct a c - chart for the data .
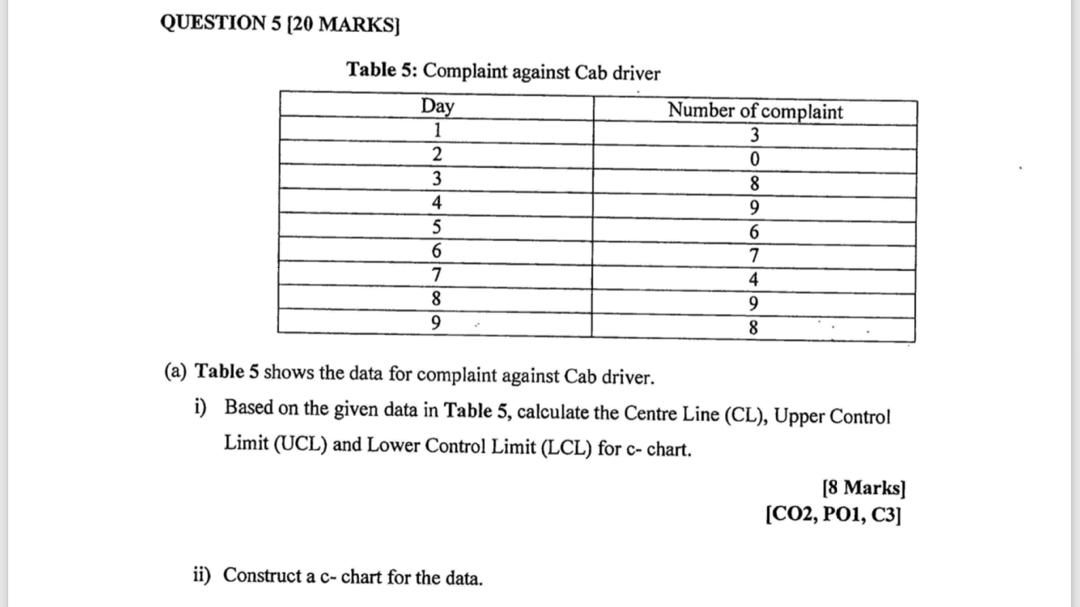
QUESTION 5 [20 MARKS] Table 5: Complaint against Cab driver Day Number of complaint JaUAWNN w (a) Table 5 shows the data for complaint against Cab driver. i) Based on the given data in Table 5, calculate the Centre Line (CL), Upper Control Limit (UCL) and Lower Control Limit (LCL) for c- chart. [8 Marks] [CO2, POI, C3] ii) Construct a c- chart for the data
Step by Step Solution
There are 3 Steps involved in it
1 Expert Approved Answer
Step: 1 Unlock

Question Has Been Solved by an Expert!
Get step-by-step solutions from verified subject matter experts
Step: 2 Unlock
Step: 3 Unlock