

Question: Exercise 7-3: Maximization of real power absorbed by the load Consider the circuit model of an AC power transmission system shown in Figure 7-6
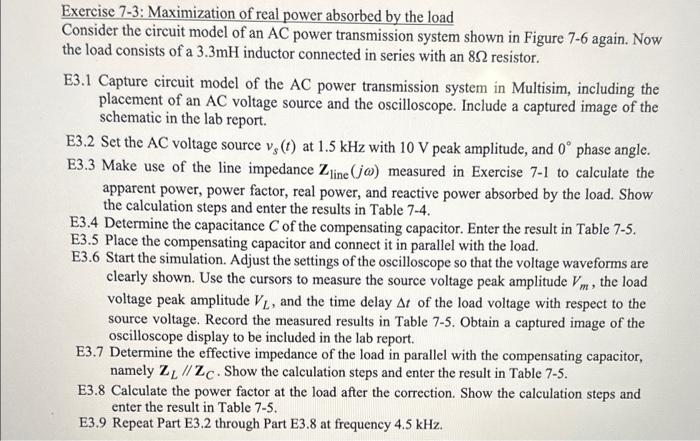
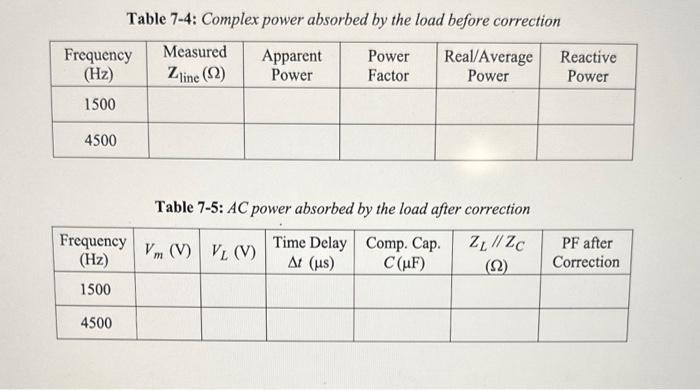
Exercise 7-3: Maximization of real power absorbed by the load Consider the circuit model of an AC power transmission system shown in Figure 7-6 again. Now the load consists of a 3.3mH inductor connected in series with an 802 resistor. E3.1 Capture circuit model of the AC power transmission system in Multisim, including the placement of an AC voltage source and the oscilloscope. Include a captured image of the schematic in the lab report. E3.2 Set the AC voltage source v, (t) at 1.5 kHz with 10 V peak amplitude, and 0 phase angle. E3.3 Make use of the line impedance Zline (jo) measured in Exercise 7-1 to calculate the apparent power, power factor, real power, and reactive power absorbed by the load. Show the calculation steps and enter the results in Table 7-4. E3.4 Determine the capacitance C of the compensating capacitor. Enter the result in Table 7-5. E3.5 Place the compensating capacitor and connect it in parallel with the load. E3.6 Start the simulation. Adjust the settings of the oscilloscope so that the voltage waveforms are clearly shown. Use the cursors to measure the source voltage peak amplitude Vm, the load voltage peak amplitude V, and the time delay At of the load voltage with respect to the source voltage. Record the measured results in Table 7-5. Obtain a captured image of the oscilloscope display to be included in the lab report. E3.7 Determine the effective impedance of the load in parallel with the compensating capacitor, namely Z//Zc. Show the calculation steps and enter the result in Table 7-5. E3.8 Calculate the power factor at the load after the correction. Show the calculation steps and enter the result in Table 7-5. E3.9 Repeat Part E3.2 through Part E3.8 at frequency 4.5 kHz. Table 7-4: Complex power absorbed by the load before correction Measured Zline (2) Frequency (Hz) 1500 4500 Frequency (Hz) 1500 4500 Apparent Power Power Factor Real/Average Power Table 7-5: AC power absorbed by the load after correction Vm (V) VL (V) ZL // ZC (22) Time Delay Comp. Cap. ' (s) C(F) Reactive Power PF after Correction
Step by Step Solution
3.43 Rating (156 Votes )
There are 3 Steps involved in it

Get step-by-step solutions from verified subject matter experts