

Question: Completing this activity will help you learn to: - Determine measures of current position using financial statement analysis. - Extract information from a data set
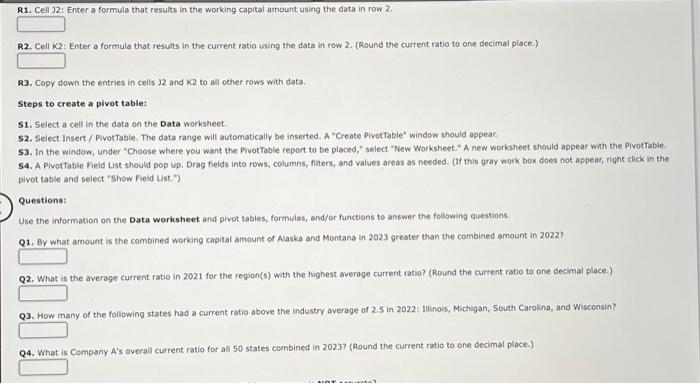

Completing this activity will help you learn to: - Determine measures of current position using financial statement analysis. - Extract information from a data set using Excel formulas, functions, and/or pivot tables. Scenario: Company A sells the same product in each of the 50 states in the U.S. The Data worksheet contains a list of states with select balance sheet amounts for each of three years. Each row provides information about one state in one year, including its region and amounts for its four current assets and one current liability. Required: Q5. Which of the following statements about current position measures is NOT accurate? R1. Cell 12; Enter a formula that results in the working capital amount using the data in row 2 . R2. Cell K2: Enter a formula that results in the current ratio using the data in row 2. (Round the current ratio to one decimal place.) R3. Copy down the entries in cells 32 and k2 to all other rows with data. Steps to create a pivot tablet 51. Select a cell in the data on the Data worksheet. 52. Select Insert / Pivot Table. The data range will automatically be inserted. A "Create PivotTable" window should appear. 53. In the window, under "Choose where you want the Pivot Table report to be placed," select "New Worksheet: A new worksheet should appear with the Pivothable: S4. A PivotTable Field List should pop up. Drag fields into rows, columns, filters, and values areas as needed. (if this gray work box does not appear, right click in the pivot table and select "Show Field ust."? Questions: Use the information on the Data worksheet and pivot tables, formulas, and/or functions to answer the following questions. Q1. By what amount is the combined working capital amount of Alaska and Montana in 2023 greater than the combined amount in 2022 ? Q2. What is the average current ratio in 2021 for the region(s) with the highest average current ratio? (Round the current ratio to one decimal place.) Q3. How many of the following states had a current ratio above the industry average of 2.5 in 2022: 1llinois, Michigan, South Carolina, and Wisconsin? Q4. What is Company A's overall current ratio for all 50 states combined in 2023 ? (Round the current ratio to one decimal place.)
Step by Step Solution
There are 3 Steps involved in it

Get step-by-step solutions from verified subject matter experts