

Question: Compute and interpret the mean of the random variable x Suppose the following data represent the ratings (on a scale from 1 to 5) for
Compute and interpret the mean of the random variable x
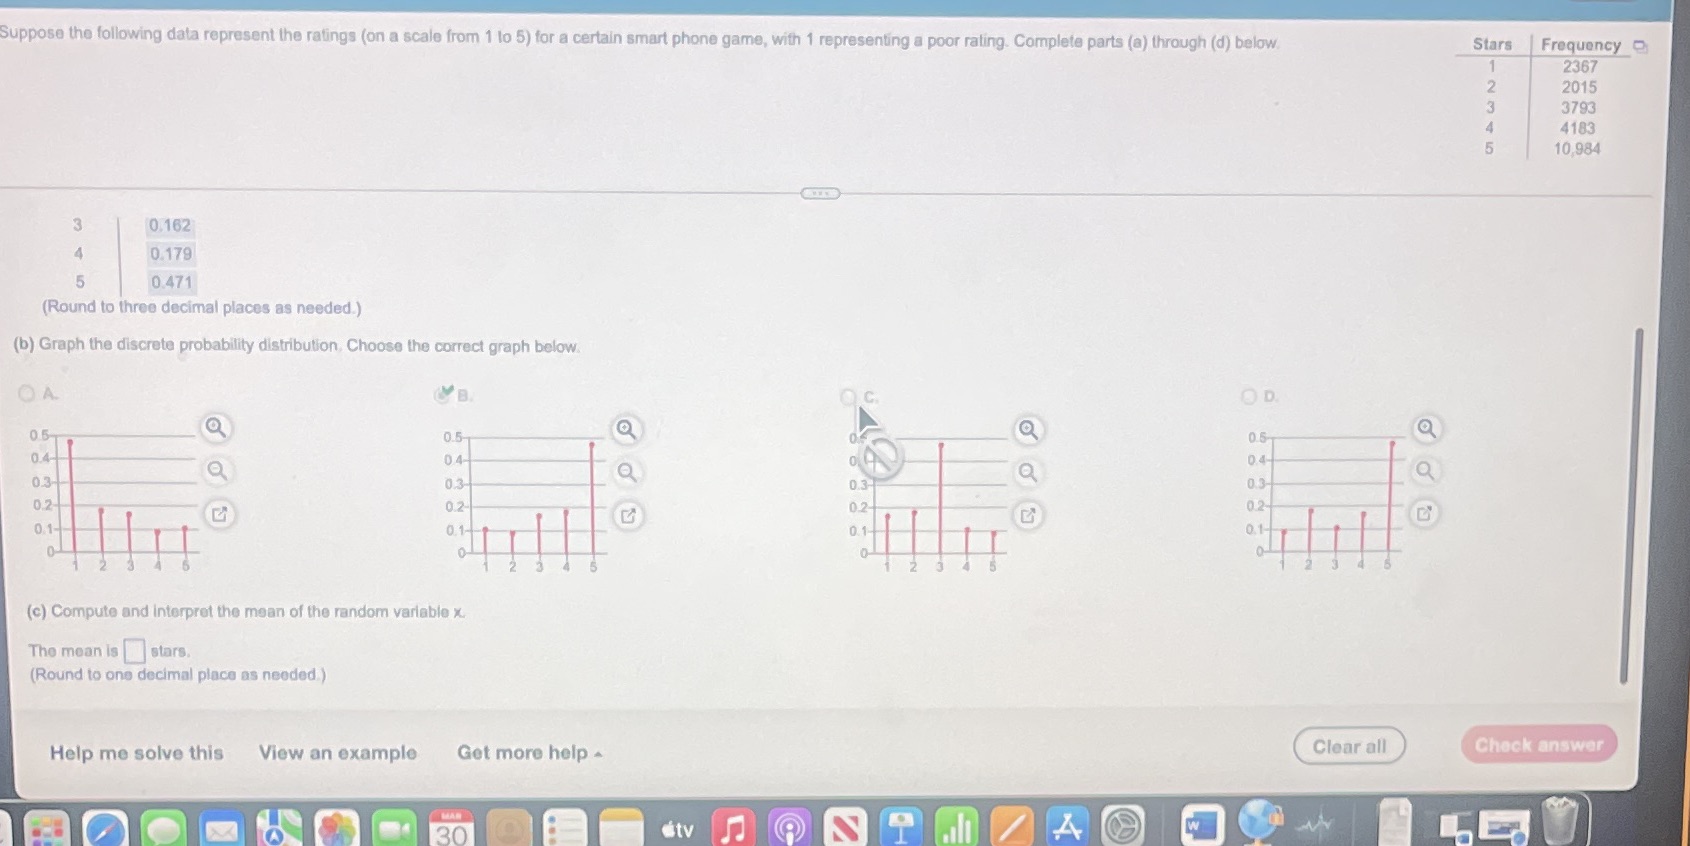
Suppose the following data represent the ratings (on a scale from 1 to 5) for a certain smart phone game, with 1 representing a poor rating. Complete parts (a) through (d) below Stars Frequency 2367 2015 3793 4183 10.984 0.162 A 0.179 5 0.471 (Round to three decimal places as needed.) (b) Graph the discrete probability distribution, Choose the correct graph below OA. Q.C. OD 0.5- 0.5 Q 0.4 0.5- a 04- 0.3 0.4- 0.3 0.2- 0.3 0.3- 0.2 0.1 0.2 0.2- (c) Compute and interpret the mean of the random variable x The mean is stars. (Round to one decimal place as needed.) Help me solve this View an example Get more help - Clear all Check answer MAN 30
Step by Step Solution
There are 3 Steps involved in it

Get step-by-step solutions from verified subject matter experts