

Question: Suppose the following data represent the ratings (on a scale from 1 to 5) for a certain smart phone game, with 1 representing a poor
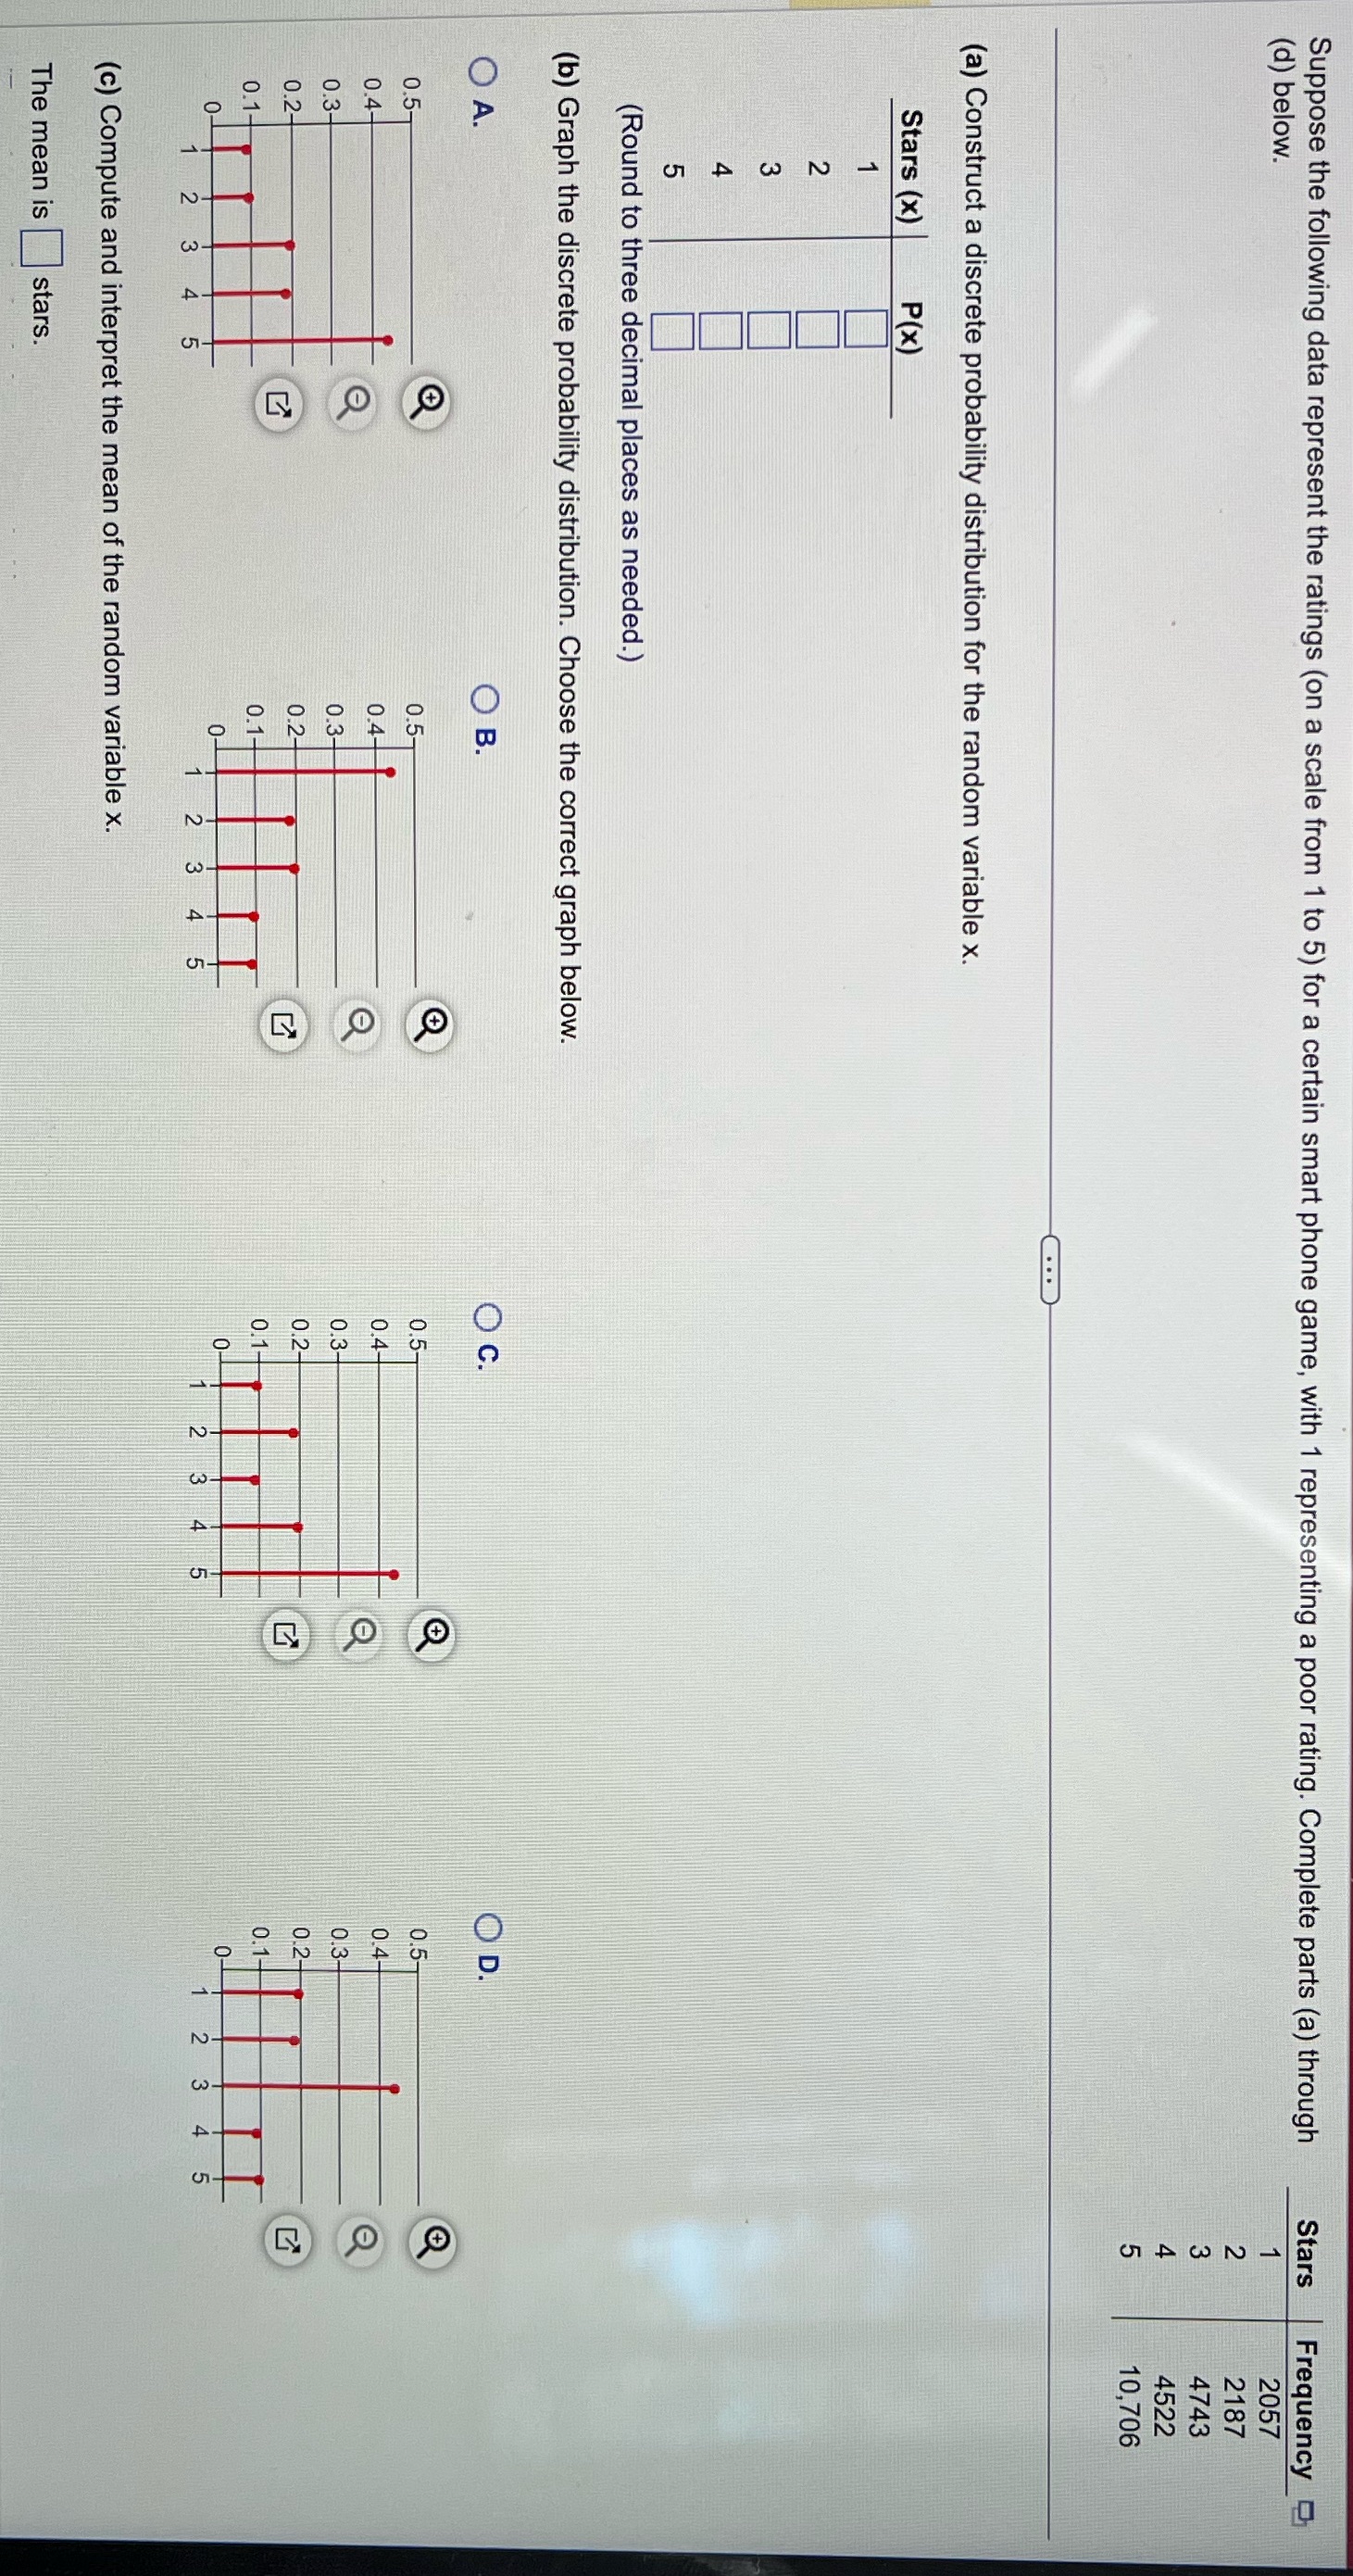
Suppose the following data represent the ratings (on a scale from 1 to 5) for a certain smart phone game, with 1 representing a poor rating. Complete parts (a) through Stars Frequency (d) below. 2057 2187 - NOVI 4743 4522 10,706 (a) Construct a discrete probability distribution for the random variable x. Stars (x) P(x) T + LO (Round to three decimal places as needed.) (b) Graph the discrete probability distribution. Choose the correct graph below. O A. O B. O c. OD. 0.5 0.5- 0.4- O 0.3- 0.3- N 0.2 3 2 3 (c) Compute and interpret the mean of the random variable x. The mean is stars
Step by Step Solution
There are 3 Steps involved in it
1 Expert Approved Answer
Step: 1 Unlock

Question Has Been Solved by an Expert!
Get step-by-step solutions from verified subject matter experts
Step: 2 Unlock
Step: 3 Unlock