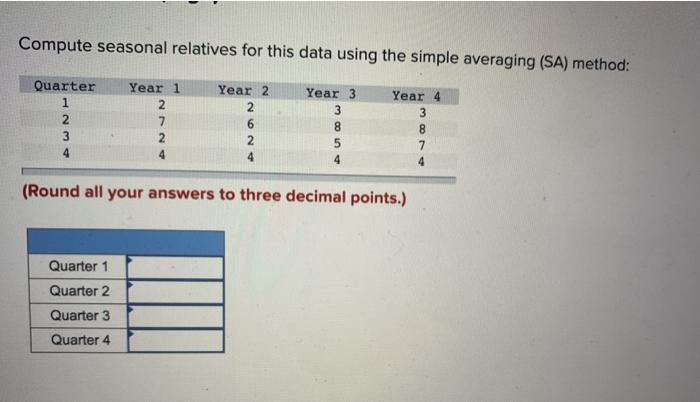
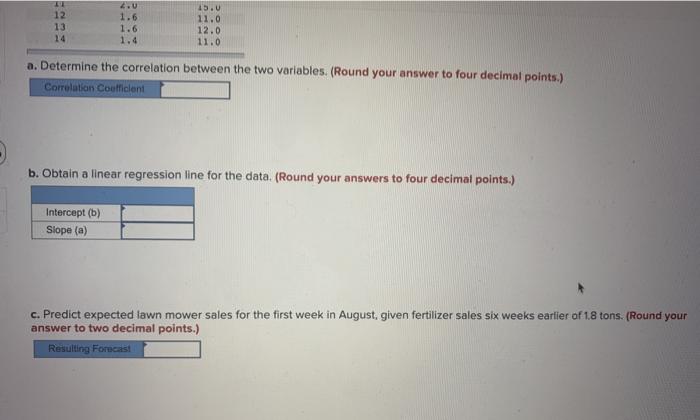
Question: Compute seasonal relatives for this data using the simple averaging (SA) method: Quarter 1 2 3 4 Year 1 2 7 2 4 Year 2

Compute seasonal relatives for this data using
Compute seasonal relatives for this data using the simple averaging (SA) method: Quarter 1 2 3 4 Year 1 2 7 2 4 Year 2 2 6 2 4 Year 3 3 8 5 4 Year 4 3 8 7 4 (Round all your answers to three decimal points.) Quarter 1 Quarter 2 Quarter 3 Quarter 4 A manager of a store that sells and installs spas wants to prepare a forecast for January, February, and March of next year. Her forecasts are a combination of trend and seasonality. She uses the following equation to estimate the trend component of monthly demand: F2 = 90 + 3t, where t=0 in June of last year. Seasonal relatives are 1.00 for January 96 for February, and 95 for March. What demands should she predict? (Round your answers to 2 decimal places.) Forecast Month January of the next year February of the next year March of the next year An electrical contractor's records during the last five weeks indicate the number of job requests: Week: Requests: 1 28 2 30 3 22 4 29 5 30 Click here for the Excel Data File Predict the number of requests for week 6 using each of these methods: a. Naive. Number of requests b. A four-period moving average. (Round your answer to 2 decimal places.) Number of requests Number of requests Saved b. A four-period moving average. (Round your answer to 2 decimal places.) Number of requests c. Exponential smoothing with a = 0.10. Use 28 for week 2 forecast. (Round your intermediate forecast values and final answers to 2 decimal places.) Number of Requests F3 F4 F5 F6 TY Homework Saved Help Save 2 3 4 Lovely Lawns, Inc., Intends to use sales of lawn fertilizer to predict lawn mower sales. The store manager estimates a probable six- week lag between fertilizer sales and mower sales. The pertinent data are: Fertiliter Number of Period Sales Movers Sold 1 1.8 11.0 1.5 13.0 1.9 2.1 15.0 16.0 1.7 12.0 13.0 1.6 1.6 13.0 10 10.0 11 2.0 15.0 1.6 11.0 13 1.6 12.0 11.0 7 69 9 12 a. Determine the correlation between the two variables. (Round your answer to four decimal points.) Carmulation Content b. Obtain a linear regression line for the data. (Round your answers to four decimal points.) Intercept (6) Slope (0) 12 13 14 2.0 1.6 1.6 15.0 11.0 12.0 11.0 1.4 a. Determine the correlation between the two variables. (Round your answer to four decimal points.) Correlation coefficient b. Obtain a linear regression line for the data. (Round your answers to four decimal points.) Intercept (b) Slope (a) c. Predict expected lawn mower sales for the first week in August, given fertilizer sales six weeks earlier of 1.8 tons. (Round your answer to two decimal points.) Resulting Forecast Compute seasonal relatives for this data using the simple averaging (SA) method: Quarter 1 2 3 4 Year 1 2 7 2 4 Year 2 2 6 2 4 Year 3 3 8 5 4 Year 4 3 8 7 4 (Round all your answers to three decimal points.) Quarter 1 Quarter 2 Quarter 3 Quarter 4 A manager of a store that sells and installs spas wants to prepare a forecast for January, February, and March of next year. Her forecasts are a combination of trend and seasonality. She uses the following equation to estimate the trend component of monthly demand: F2 = 90 + 3t, where t=0 in June of last year. Seasonal relatives are 1.00 for January 96 for February, and 95 for March. What demands should she predict? (Round your answers to 2 decimal places.) Forecast Month January of the next year February of the next year March of the next year An electrical contractor's records during the last five weeks indicate the number of job requests: Week: Requests: 1 28 2 30 3 22 4 29 5 30 Click here for the Excel Data File Predict the number of requests for week 6 using each of these methods: a. Naive. Number of requests b. A four-period moving average. (Round your answer to 2 decimal places.) Number of requests Number of requests Saved b. A four-period moving average. (Round your answer to 2 decimal places.) Number of requests c. Exponential smoothing with a = 0.10. Use 28 for week 2 forecast. (Round your intermediate forecast values and final answers to 2 decimal places.) Number of Requests F3 F4 F5 F6 TY Homework Saved Help Save 2 3 4 Lovely Lawns, Inc., Intends to use sales of lawn fertilizer to predict lawn mower sales. The store manager estimates a probable six- week lag between fertilizer sales and mower sales. The pertinent data are: Fertiliter Number of Period Sales Movers Sold 1 1.8 11.0 1.5 13.0 1.9 2.1 15.0 16.0 1.7 12.0 13.0 1.6 1.6 13.0 10 10.0 11 2.0 15.0 1.6 11.0 13 1.6 12.0 11.0 7 69 9 12 a. Determine the correlation between the two variables. (Round your answer to four decimal points.) Carmulation Content b. Obtain a linear regression line for the data. (Round your answers to four decimal points.) Intercept (6) Slope (0) 12 13 14 2.0 1.6 1.6 15.0 11.0 12.0 11.0 1.4 a. Determine the correlation between the two variables. (Round your answer to four decimal points.) Correlation coefficient b. Obtain a linear regression line for the data. (Round your answers to four decimal points.) Intercept (b) Slope (a) c. Predict expected lawn mower sales for the first week in August, given fertilizer sales six weeks earlier of 1.8 tons. (Round your answer to two decimal points.) Resulting Forecast

Step by Step Solution

There are 3 Steps involved in it

1 Expert Approved Answer
Step: 1 Unlock blur-text-image
Question Has Been Solved by an Expert!

Get step-by-step solutions from verified subject matter experts

Step: 2 Unlock
Step: 3 Unlock

Students Have Also Explored These Related General Management Questions!