

Question: Compute the financial ratios for Microsoft. For this assignment, use the designated formulas listed in Table 3. You are welcome to use EXCEL or do
Compute the financial ratios for Microsoft. For this assignment, use the designated formulas listed in Table 3. You are welcome to use EXCEL or do them with a calculator.
Financial Ratios Visualization for (GICS Sector) industry information and compare your results with the industry averages you find. For this assignment, please use the industry averages located in WRDS.
Put your analysis in the format below or create your own so long as it is easy to read in Table 2.
Table 2. Example Table for the Assignment
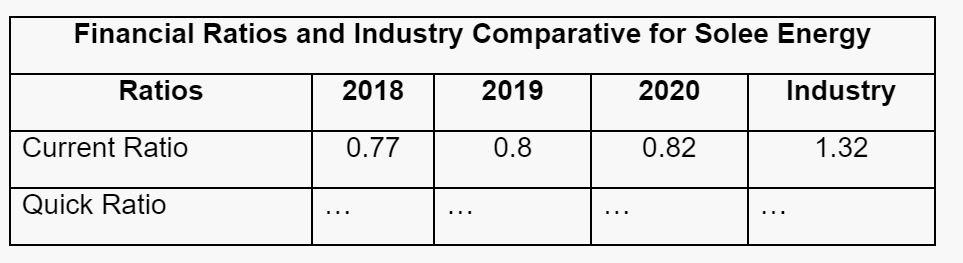
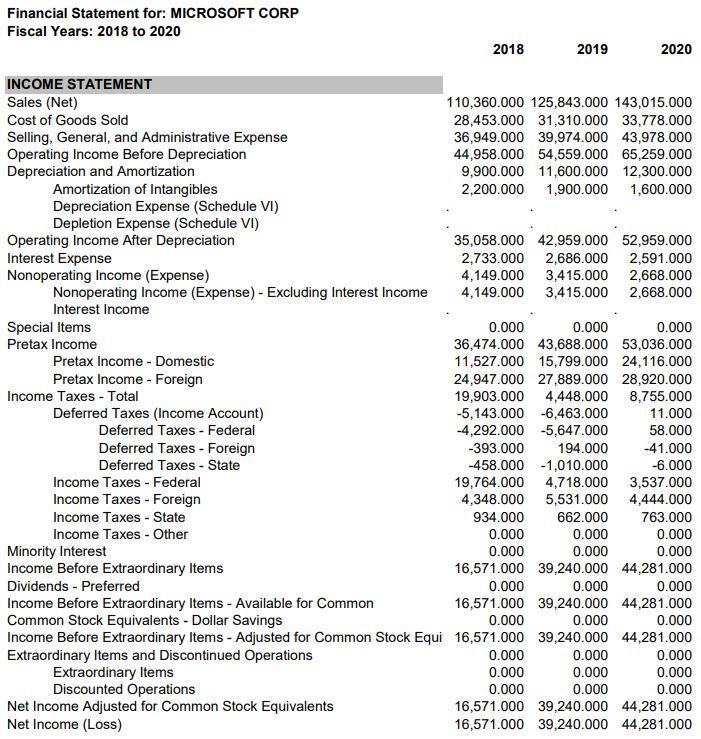
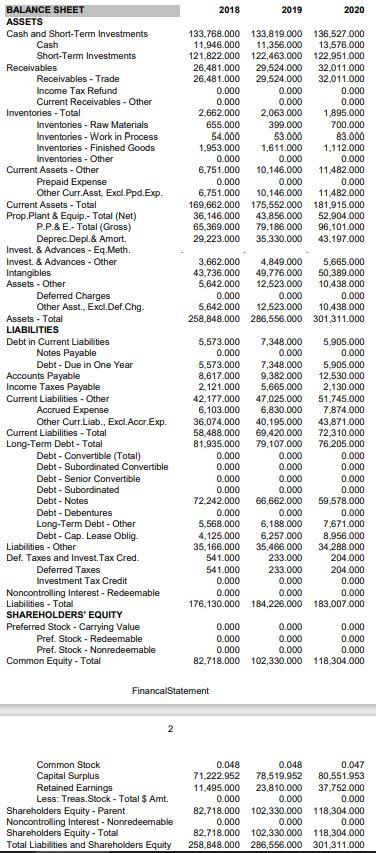
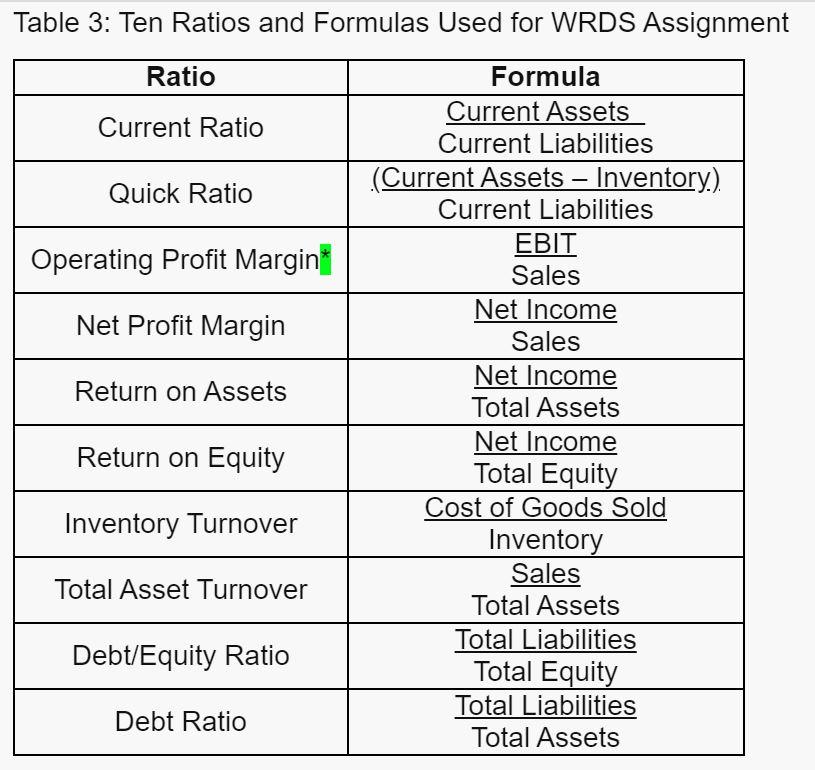
- Table 3: Ten Ratios and Formulas Used for WRDS Assignment Ratio Formula Current Assets Current Ratio Current Liabilities (Current Assets Inventory.). Quick Ratio Current Liabilities EBIT Operating Profit Margint Sales Net Income Net Profit Margin Sales Net Income Return on Assets Total Assets Net Income Return on Equity Total Equity Cost of Goods Sold Inventory Turnover Inventory Sales Total Asset Turnover Total Assets Total Liabilities Debt/Equity Ratio Total Equity Total Liabilities Debt Ratio Total Assets Financial Ratios and Industry Comparative for Solee Energy Ratios 2018 2019 2020 Industry Current Ratio 0.77 0.8 0.82 1.32 Quick Ratio ... .. Financial Statement for: MICROSOFT CORP Fiscal Years: 2018 to 2020 2018 2019 2020 INCOME STATEMENT Sales (Net) 110,360.000 125,843.000 143,015.000 Cost of Goods Sold 28,453.000 31,310.000 33,778.000 Selling, General, and Administrative Expense 36,949.000 39,974.000 43,978.000 Operating Income Before Depreciation 44,958.000 54,559.000 65,259.000 Depreciation and Amortization 9,900.000 11.600.000 12,300.000 Amortization of Intangibles 2,200.000 1,900.000 1,600.000 Depreciation Expense (Schedule VI) Depletion Expense (Schedule VI) Operating Income After Depreciation 35,058.000 42,959.000 52,959.000 Interest Expense 2,733.000 2,686.000 2,591.000 Nonoperating Income (Expense) 4,149.000 3,415.000 2,668.000 Nonoperating Income (Expense) - Excluding Interest Income 4,149.000 3,415.000 2,668.000 Interest Income Special Items 0.000 0.000 0.000 Pretax Income 36,474.000 43,688.000 53,036.000 Pretax Income - Domestic 11,527.000 15,799.000 24,116.000 Pretax Income - Foreign 24,947.000 27,889.000 28,920.000 Income Taxes - Total 19,903.000 4,448.000 8,755.000 Deferred Taxes (Income Account) -5,143.000 -6,463.000 11.000 Deferred Taxes - Federal -4,292.000 -5,647.000 58.000 Deferred Taxes - Foreign -393.000 194.000 -41.000 Deferred Taxes - State -458.000 -1.010.000 -6.000 Income Taxes - Federal 19,764.000 4,718.000 3,537.000 Income Taxes - Foreign 4,348.000 5,531.000 4,444.000 Income Taxes - State 934.000 662.000 763.000 Income Taxes - Other 0.000 0.000 0.000 Minority Interest 0.000 0.000 0.000 Income Before Extraordinary Items 16,571.000 39,240.000 44,281.000 Dividends - Preferred 0.000 0.000 0.000 Income Before Extraordinary Items - Available for Common 16,571.000 39,240.000 44,281.000 Common Stock Equivalents - Dollar Savings 0.000 0.000 0.000 Income Before Extraordinary Items - Adjusted for Common Stock Equi16,571.000 39,240.000 44,281.000 Extraordinary Items and Discontinued Operations 0.000 0.000 0.000 Extraordinary Items 0.000 0.000 0.000 Discounted Operations 0.000 0.000 0.000 Net Income Adjusted for Common Stock Equivalents 16,571.000 39,240.000 44,281.000 Net Income (Loss) 16,571.000 39,240.000 44,281.000 2018 2019 2020 133.768.000 133,819.000 136,527.000 11.946.000 11,356.000 13,576.000 121,822.000 122,463.000 122.951.000 26.481.000 29,524.000 32,011.000 26,481.000 29,524.000 32.011.000 0.000 0.000 0.000 0.000 0.000 0.000 2,662.000 2,063.000 1.895.000 655.000 399.000 700.000 54.000 53.000 83.000 1,953.000 1,611.000 1.112.000 0.000 0.000 0.000 6.751.000 10.146.000 11.482.000 0.000 0.000 0.000 6.751.000 10.146.000 11.482.000 169,662.000 175,552.000 181.915.000 36.146.000 43,856.000 52.904.000 65,369.000 79,186.000 96, 101.000 29.223.000 35,330.000 43.197.000 3,662.000 4,849.000 5,665.000 43.736.000 49.776.000 50,389.000 5.642.000 12.523.000 10.438.000 0.000 0.000 0.000 5,642.000 12,523.000 10.438.000 258,848.000 286,556.000 301,311.000 BALANCE SHEET ASSETS Cash and Short-Term Investments Cash Short-Term Investments Receivables Receivables - Trade Income Tax Refund Current Receivables - Other Inventories - Total Inventories - Raw Materials Inventories - Work in Process Inventories - Finished Goods Inventories - Other Current Assets - Other Prepaid Expense Other Curr.Asst. Excl. Ppd.Exp. Current Assets - Total Prop.Plant & Equip.- Total (Net) P.P.& E.- Total (Gross) Deprec.Depl.& Amort. Invest. & Advances - Eq. Meth. Invest. & Advances - Other Intangibles Assets - Other Deferred Charges Other Asst., Excl.Def. Chg. Assets - Total LIABILITIES Debt in Current Liabilities Notes Payable Debt-Due in One Year Accounts Payable Income Taxes Payable Current Liabilities - Other Accrued Expense Other Curr.Liab., Excl.Acor.Exp. Current Liabilities - Total Long-Term Debt - Total Debt - Convertible (Total) Debt - Subordinated Convertible Debt - Senior Convertible Debt - Subordinated Debt - Notes Debt-Debentures Long-Term Debt - Other Debt-Cap. Lease Oblig Liabilities - Other Def. Taxes and Invest.Tax Cred. Deferred Taxes Investment Tax Credit Noncontrolling Interest - Redeemable Liabilities - Total SHAREHOLDERS' EQUITY Preferred Stock - Carrying Value Pref. Stock - Redeemable Pref. Stock - Nonredeemable Common Equity - Total 5.573.000 7,348.000 5,905.000 0.000 0.000 0.000 5,573.000 7,348.000 5,905.000 8,617.000 9,382.000 12,530.000 2.121.000 5,665.000 2,130.000 42.177.000 47,025.000 51.745.000 6,103.000 6,830.000 7,874.000 36.074.000 40,195.000 43.871.000 58,488.000 69,420.000 72.310.000 81.935.000 79,107.000 76.205.000 0.000 0.000 0.000 0.000 0.000 0.000 0.000 0.000 0.000 0.000 0.000 0.000 72,242.000 66,662.000 59,578.000 0.000 0.000 0.000 5,568.000 6,188.000 7,671.000 4,125.000 6,257.000 8,956.000 35,166.000 35,466.000 34 288.000 541.000 233.000 204.000 541.000 233.000 204.000 0.000 0.000 0.000 0.000 0.000 0.000 176.130.000 184,226.000 183.007.000 0.000 0.000 0.000 0.000 0.000 0.000 0.000 0.000 0.000 82,718.000 102,330.000 118.304.000 FinancalStatement 2 Common Stock Capital Surplus Retained Earnings Less: Treas. Stock - Total $ Amt. Shareholders Equity - Parent Noncontrolling Interest - Nonredeemable Shareholders Equity - Total Total Liabilities and Shareholders Equity 0.048 0.048 0.047 71.222.952 78,519.952 80,551.953 11.495.000 23,810.000 37,752.000 0.000 0.000 0.000 82,718.000 102,330.000 118,304.000 0.000 0.000 0.000 82.718.000 102,330.000 118,304.000 258.848.000 286,556.000 301.311.000 - Table 3: Ten Ratios and Formulas Used for WRDS Assignment Ratio Formula Current Assets Current Ratio Current Liabilities (Current Assets Inventory.). Quick Ratio Current Liabilities EBIT Operating Profit Margint Sales Net Income Net Profit Margin Sales Net Income Return on Assets Total Assets Net Income Return on Equity Total Equity Cost of Goods Sold Inventory Turnover Inventory Sales Total Asset Turnover Total Assets Total Liabilities Debt/Equity Ratio Total Equity Total Liabilities Debt Ratio Total Assets Financial Ratios and Industry Comparative for Solee Energy Ratios 2018 2019 2020 Industry Current Ratio 0.77 0.8 0.82 1.32 Quick Ratio ... .. Financial Statement for: MICROSOFT CORP Fiscal Years: 2018 to 2020 2018 2019 2020 INCOME STATEMENT Sales (Net) 110,360.000 125,843.000 143,015.000 Cost of Goods Sold 28,453.000 31,310.000 33,778.000 Selling, General, and Administrative Expense 36,949.000 39,974.000 43,978.000 Operating Income Before Depreciation 44,958.000 54,559.000 65,259.000 Depreciation and Amortization 9,900.000 11.600.000 12,300.000 Amortization of Intangibles 2,200.000 1,900.000 1,600.000 Depreciation Expense (Schedule VI) Depletion Expense (Schedule VI) Operating Income After Depreciation 35,058.000 42,959.000 52,959.000 Interest Expense 2,733.000 2,686.000 2,591.000 Nonoperating Income (Expense) 4,149.000 3,415.000 2,668.000 Nonoperating Income (Expense) - Excluding Interest Income 4,149.000 3,415.000 2,668.000 Interest Income Special Items 0.000 0.000 0.000 Pretax Income 36,474.000 43,688.000 53,036.000 Pretax Income - Domestic 11,527.000 15,799.000 24,116.000 Pretax Income - Foreign 24,947.000 27,889.000 28,920.000 Income Taxes - Total 19,903.000 4,448.000 8,755.000 Deferred Taxes (Income Account) -5,143.000 -6,463.000 11.000 Deferred Taxes - Federal -4,292.000 -5,647.000 58.000 Deferred Taxes - Foreign -393.000 194.000 -41.000 Deferred Taxes - State -458.000 -1.010.000 -6.000 Income Taxes - Federal 19,764.000 4,718.000 3,537.000 Income Taxes - Foreign 4,348.000 5,531.000 4,444.000 Income Taxes - State 934.000 662.000 763.000 Income Taxes - Other 0.000 0.000 0.000 Minority Interest 0.000 0.000 0.000 Income Before Extraordinary Items 16,571.000 39,240.000 44,281.000 Dividends - Preferred 0.000 0.000 0.000 Income Before Extraordinary Items - Available for Common 16,571.000 39,240.000 44,281.000 Common Stock Equivalents - Dollar Savings 0.000 0.000 0.000 Income Before Extraordinary Items - Adjusted for Common Stock Equi16,571.000 39,240.000 44,281.000 Extraordinary Items and Discontinued Operations 0.000 0.000 0.000 Extraordinary Items 0.000 0.000 0.000 Discounted Operations 0.000 0.000 0.000 Net Income Adjusted for Common Stock Equivalents 16,571.000 39,240.000 44,281.000 Net Income (Loss) 16,571.000 39,240.000 44,281.000 2018 2019 2020 133.768.000 133,819.000 136,527.000 11.946.000 11,356.000 13,576.000 121,822.000 122,463.000 122.951.000 26.481.000 29,524.000 32,011.000 26,481.000 29,524.000 32.011.000 0.000 0.000 0.000 0.000 0.000 0.000 2,662.000 2,063.000 1.895.000 655.000 399.000 700.000 54.000 53.000 83.000 1,953.000 1,611.000 1.112.000 0.000 0.000 0.000 6.751.000 10.146.000 11.482.000 0.000 0.000 0.000 6.751.000 10.146.000 11.482.000 169,662.000 175,552.000 181.915.000 36.146.000 43,856.000 52.904.000 65,369.000 79,186.000 96, 101.000 29.223.000 35,330.000 43.197.000 3,662.000 4,849.000 5,665.000 43.736.000 49.776.000 50,389.000 5.642.000 12.523.000 10.438.000 0.000 0.000 0.000 5,642.000 12,523.000 10.438.000 258,848.000 286,556.000 301,311.000 BALANCE SHEET ASSETS Cash and Short-Term Investments Cash Short-Term Investments Receivables Receivables - Trade Income Tax Refund Current Receivables - Other Inventories - Total Inventories - Raw Materials Inventories - Work in Process Inventories - Finished Goods Inventories - Other Current Assets - Other Prepaid Expense Other Curr.Asst. Excl. Ppd.Exp. Current Assets - Total Prop.Plant & Equip.- Total (Net) P.P.& E.- Total (Gross) Deprec.Depl.& Amort. Invest. & Advances - Eq. Meth. Invest. & Advances - Other Intangibles Assets - Other Deferred Charges Other Asst., Excl.Def. Chg. Assets - Total LIABILITIES Debt in Current Liabilities Notes Payable Debt-Due in One Year Accounts Payable Income Taxes Payable Current Liabilities - Other Accrued Expense Other Curr.Liab., Excl.Acor.Exp. Current Liabilities - Total Long-Term Debt - Total Debt - Convertible (Total) Debt - Subordinated Convertible Debt - Senior Convertible Debt - Subordinated Debt - Notes Debt-Debentures Long-Term Debt - Other Debt-Cap. Lease Oblig Liabilities - Other Def. Taxes and Invest.Tax Cred. Deferred Taxes Investment Tax Credit Noncontrolling Interest - Redeemable Liabilities - Total SHAREHOLDERS' EQUITY Preferred Stock - Carrying Value Pref. Stock - Redeemable Pref. Stock - Nonredeemable Common Equity - Total 5.573.000 7,348.000 5,905.000 0.000 0.000 0.000 5,573.000 7,348.000 5,905.000 8,617.000 9,382.000 12,530.000 2.121.000 5,665.000 2,130.000 42.177.000 47,025.000 51.745.000 6,103.000 6,830.000 7,874.000 36.074.000 40,195.000 43.871.000 58,488.000 69,420.000 72.310.000 81.935.000 79,107.000 76.205.000 0.000 0.000 0.000 0.000 0.000 0.000 0.000 0.000 0.000 0.000 0.000 0.000 72,242.000 66,662.000 59,578.000 0.000 0.000 0.000 5,568.000 6,188.000 7,671.000 4,125.000 6,257.000 8,956.000 35,166.000 35,466.000 34 288.000 541.000 233.000 204.000 541.000 233.000 204.000 0.000 0.000 0.000 0.000 0.000 0.000 176.130.000 184,226.000 183.007.000 0.000 0.000 0.000 0.000 0.000 0.000 0.000 0.000 0.000 82,718.000 102,330.000 118.304.000 FinancalStatement 2 Common Stock Capital Surplus Retained Earnings Less: Treas. Stock - Total $ Amt. Shareholders Equity - Parent Noncontrolling Interest - Nonredeemable Shareholders Equity - Total Total Liabilities and Shareholders Equity 0.048 0.048 0.047 71.222.952 78,519.952 80,551.953 11.495.000 23,810.000 37,752.000 0.000 0.000 0.000 82,718.000 102,330.000 118,304.000 0.000 0.000 0.000 82.718.000 102,330.000 118,304.000 258.848.000 286,556.000 301.311.000
Step by Step Solution
There are 3 Steps involved in it

Get step-by-step solutions from verified subject matter experts