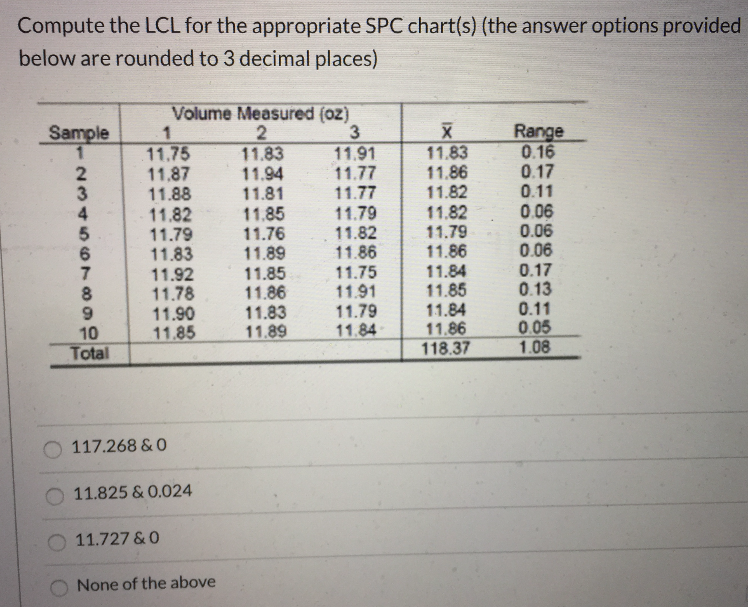
Question: Compute the LCL for the appropriate SPC chart(s) (the answer options provided below are rounded to 3 decimal places) Volume Measured (oz) Sample 11.91 11.75

Compute the LCL for the appropriate SPC chart(s)Compute the LCL for the appropriate SPC chart(s)Compute the LCL for the appropriate SPC chart(s)Compute the LCL for the appropriate SPC chart(s)

Compute the LCL for the appropriate SPC chart(s) (the answer options provided below are rounded to 3 decimal places) Volume Measured (oz) Sample 11.91 11.75 11.87 11.88 11.82 11.79 11.83 11.92 11.78 11.90 11.85 11.83 11.94 11.81 11.85 11.76 11.89 11.85 11.86 11.83 11.89 11.77 11.77 11.79 11.82 11.86 11.75 11.91 11.79 11.84 11.83 11.86 11.82 11.82 11.79 11.86 11.84 11.85 11.84 11.86 118.37 Range 0.16 0.17 0.11 0.06 0.06 0.06 0.17 0.13 10 Total 0.11 0.05 1.08 117.268 & 0 11.825 & 0.024 11.727&0 None of the above A manager of a construction supply house determined from historical records that average lead time is 16 days. The daily demand rate can be described by a normal distribution that has a mean of 10 tons and a standard deviation of 2 tons. In addition, the manager wants no more than a 1% risk of stock out. Compute the reorder level. In an EOQ model, the manager determines that the current optimal order quantity is 2500 units. The annual ordering costs given the optimal order quantity level is $1500. Determine the annual carrying cost

Step by Step Solution

There are 3 Steps involved in it

1 Expert Approved Answer
Step: 1 Unlock blur-text-image
Question Has Been Solved by an Expert!

Get step-by-step solutions from verified subject matter experts

Step: 2 Unlock
Step: 3 Unlock

Students Have Also Explored These Related General Management Questions!