

Question: Compute the variance-covariance matrix. from the returns data, I just need to know about the formula I can use for computing the covariance here are
Compute the variance-covariance matrix. from the returns data, I just need to know about the formula I can use for computing the covariance
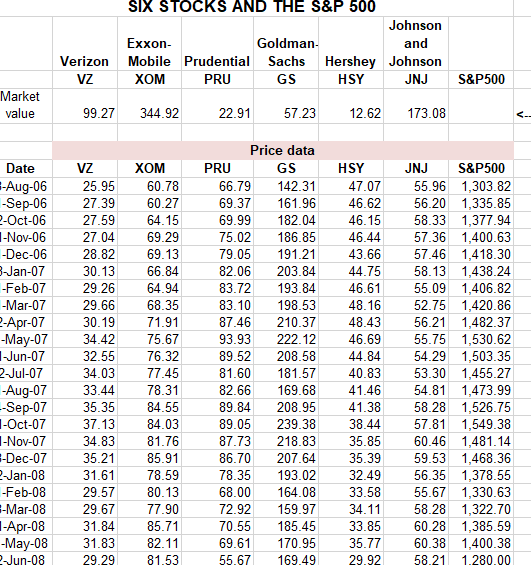
here are the returns data
here is the excel sheet for calculating the covariance, I just need a formula for calculating this, so you can just answer me the formula and the way for solving this sheet thanks,
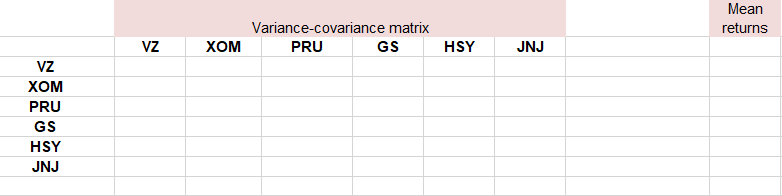
SIX STOCKS AND THE S&P 500 Johnson Exxon- Goldman and Verizon Mobile Prudential Sachs Hershey Johnson VZ XOM PRU GS HSY JNJ S&P500 Market value 99.27 344.92 22.91 57.23 12.62 173.08 Date -Aug-06 -Sep-06 2-Oct-06 1-Nov-06 -Dec-06 3-Jan-07 -Feb-07 -Mar-07 2-Apr-07 -May-07 1-Jun-07 2-Jul-07 -Aug-07 -Sep-07 1-Oct-07 1-Nov-07 E-Dec-07 2-Jan-08 -Feb-08 E-Mar-08 1-Apr-08 -May-08 Jun-08 VZ 25.95 27.39 27.59 27.04 28.82 30.13 29.26 29.66 30.19 34.42 32.55 34.03 33.44 35.35 37.13 34.83 35.21 31.61 29.57 29.67 31.84 31.83 29.29 XOM 60.78 60.27 64.15 69.29 69.13 66.84 64.94 68.35 71.91 75.67 76.32 77.45 78.31 84.55 84.03 81.76 85.91 78.59 80.13 77.90 85.71 82.11 81.53 Price data PRU GS 66.79 142.31 69.37 161.96 69.99 182.04 75.02 186.85 79.05 191.21 82.06 203.84 83.72 193.84 83.10 198.53 87.46 210.37 93.93 222.12 89.52 208.58 81.60 181.57 82.66 169.68 89.84 208.95 89.05 239.38 87.73 218.83 86.70 207.64 78.35 193.02 68.00 164.08 72.92 159.97 70.55 185.45 69.61 170.95 55.67 169.49 HSY 47.07 46.62 46.15 46.44 43.66 44.75 46.61 48.16 48.43 46.69 44.84 40.83 41.46 41.38 38.44 35.85 35.39 32.49 33.58 34.11 33.85 35.77 29.92 JNJ S&P500 55.96 1,303.82 56.20 1,335.85 58.33 1,377.94 57.36 1,400.63 57.46 1,418.30 58.13 1,438.24 55.09 1,406.82 52.75 1,420.86 56.21 1,482.37 55.75 1,530.62 54.29 1,503.35 53.30 1,455.27 54.81 1,473.99 58.28 1,526.75 57.81 1,549.38 60.46 1,481.14 59.53 1,468.36 56.35 1,378.55 55.67 1,330.63 58.28 1,322.70 60.28 1,385.59 60.38 1,400.38 58.21 1.280.00 Mean returns Variance-covariance matrix PRU GS Vz XOM HSY JNJ VZ XOM PRU GS HSY JNJ
Step by Step Solution
There are 3 Steps involved in it

Get step-by-step solutions from verified subject matter experts