

Question: Using the table below, interpret all key regression results, SUMMARY OUTPUT Regression Statistics Multiple R 0.86977145 R Square 0.75650237 Adjusted R Square 0.75070481 Standard Error
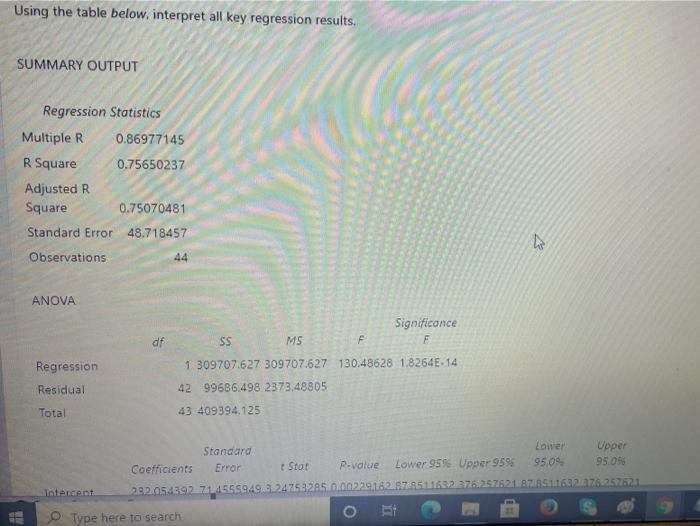
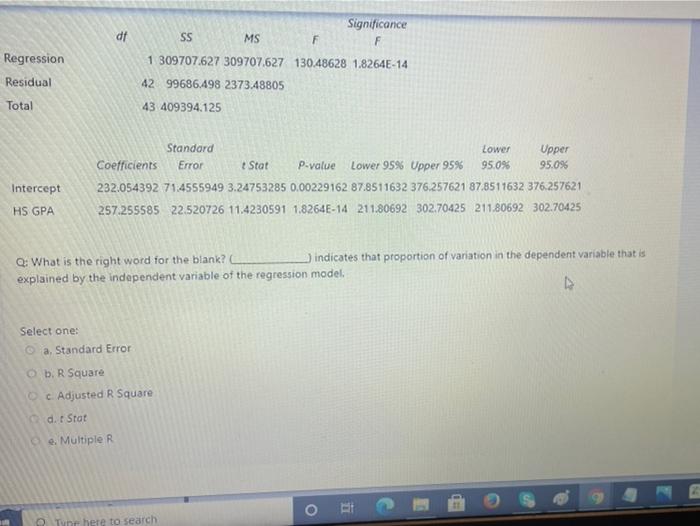
Using the table below, interpret all key regression results, SUMMARY OUTPUT Regression Statistics Multiple R 0.86977145 R Square 0.75650237 Adjusted R Square 0.75070481 Standard Error 48.718457 Observations 44 ANOVA Significance F df SS MS F Regression Residual 1 309707.627 309707.627 130.48628 1.8264E-14 4299686.498 2373,48805 Total 43 409394.125 Standard Lower Upper Coefficients Error Star P-value Lower 9596 Upper 9596 95.09 95.0 Intercent 22.05439271455594922 24253285 0.002291629755011692376.257621 11632076.257621 Type here to search 0 1 dt Regression Residual Total Significance SS MS F F 1 309707.627 309707,627 130.48628 1.8264E-14 4299686.498 2373.48805 43 409394,125 Standard Lower Upper Coefficients Error Stat P-value Lower 95% Upper 95% 95.0% 95.09 232.054392 71.4555949 3.24753285 0.00229162 87.8511632 376.257621 87.8511632 376 257621 257.255585 22.520726 11,4230591 1,8264E-14 211.80692 302.70425 211.80692 302.70425 Intercept HS GPA Q: What is the right word for the blank? indicates that proportion of variation in the dependent variable that is explained by the independent variable of the regression model. Select one: a. Standard Error b. R Square c. Adjusted R Square d. t Stat e. Multiple R o Te here to search
Step by Step Solution
There are 3 Steps involved in it

Get step-by-step solutions from verified subject matter experts